Answered step by step
Verified Expert Solution
Link Copied!

Question

1 Approved Answer

The folowing table shows the actual demand observed over the last 11 years: Using exponenlial smoothing with =0.50 and a forecast for year 1 of
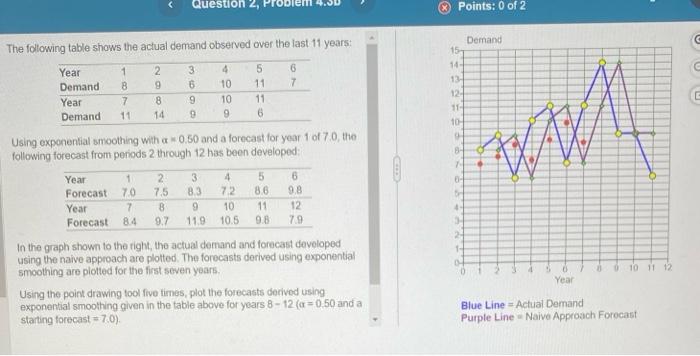
image text in transcribed
The folowing table shows the actual demand observed over the last 11 years: Using exponenlial smoothing with =0.50 and a forecast for year 1 of 7.0, the following forecast from periods 2 through 12 has been developed: In the graph shown to the right, the actual demand and forecast developed using the naive approach are plotted. The forecasts derived using exponential smoothing are plotted for the first seven years. Using the point drawing tool five times, plot the forecasts derived using exponential smoothing given in the table above for years 812(=0.50 and a starting forecast =7.0 )

Step by Step Solution

There are 3 Steps involved in it

Step: 1

blur-text-image

Get Instant Access to Expert-Tailored Solutions

See step-by-step solutions with expert insights and AI powered tools for academic success

Step: 2

blur-text-image

Step: 3

blur-text-image

Ace Your Homework with AI

Get the answers you need in no time with our AI-driven, step-by-step assistance

Get Started

Recommended Textbook for

Operations Management Sustainability And Supply Chain Management

Authors: Jay Heizer, Barry Render, Chuck Munson, Paul Griffin

4th Canadian Edition

0137319169, 978-0137319169

More Books

Students also viewed these General Management questions