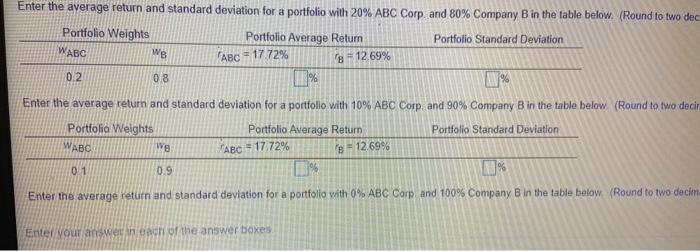
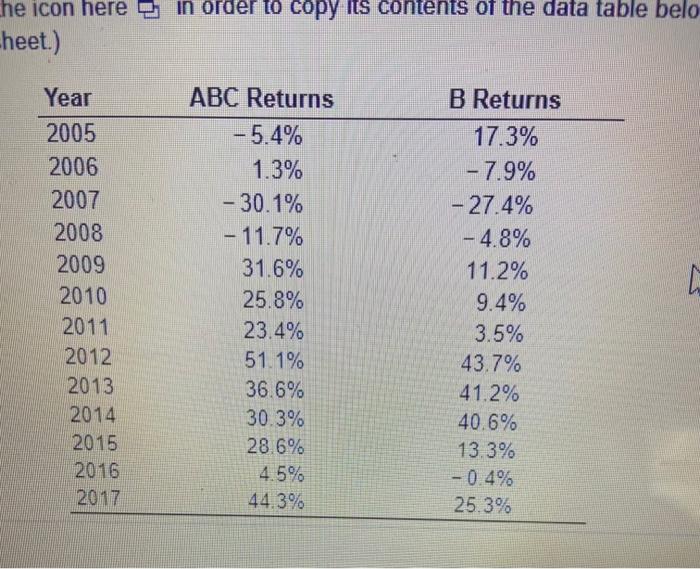
The foowing table taim anno orms for the stocks of ABC Corp (ABC) and Company Buy Themesan caoulated under prices adjusted for dividends and stock spl) Use the information for ABC Corp (ABC) and Company B (B) to create and speed that calculate the average oturns over the 10 year pedod for portfolion comprised of Anc and Bioning the wing, spect weet 180019011 03.02.203) (06, 04, 0505) 04.06.03.07)(02.001 01.0) (00.10) The age of the 10-year period for ABC and B am 17.77% and 120 cively calli Standard deviations 10.a potiled associated with each portfolio competition. The standard deviation over the 10-year period for ABC Corp and Company B and their commation concert w 2394321893 and 082522 respectively (Hint Review Table 52) Emet the average return and standard deviation for a pornitolio with 100% ABC Cound 0% Company in the table below (found to two decimal place) Portfolio Weiss Portfolio Average Retum Portfolio Standard Devi WABC 1772 10 00 Evercom and Mandard for portfolio with 90ABC Corp and 10% Company in the table below and to two decimal pleco Port Was Portfolio Argo Rotum Portfolio Standard Delton WABC 1772 05 standard deviation over the 10 year period associated with each portfolio composition. The standard deviation over the 10 year period for ABC Corp. and Compar 0.82522 respectively. (Hint Review Table 5.2) 0.9 0.1 WABC ABC = 17.72% Enter the average return and standard deviation for a portfolio with 80% ABC Corp. and 20% Company B in the table below (Round to two decimal places) Portfolio Weights Portfolio Average Rotum Portfolio Standard Deviation We 18 12 69% 0.8 0.2 Enter the average return and standard deviation for a portfolio with 70% ABC Corp and 30% Company B in the table below (Round to two decimal places Portfolio Weights Portfolio Average Return Portfolio Standard Deviation WABC Ws 0.7 0.3 ABC 17.72% - 12 69% Enter the average return and standard deviation for a portfolio with 60% ABC Corp. and 40% Company B in the table below. (Round to two decimal places) Portfolio Weights Portfolio Average Return Portfolio Standard Deviation We WABC 'ABC1772% 8 = 12 69% 0.6 0.4 Enter the average return and standard deviation for a portfolio with 50% ABC Corp. and 50% Company B in the table below. (Round to two decimal places) Portfolio Weights Portfolio Average Return Portfolio Standard Deviation WABC We % 05 05 ABC = 17.72% - 12 69% Enter the average return and standard deviation for a portfolio with 40% ABC Corp. and 60% Company B in the table below. (Round to two decimal places.) Portfolio Weights Portfolio Average Retur Portfolio Standard Deviation WABC WE ABC 17.72% 18 - 12.69% 0.4 0.6 Enter the average return and standard deviation for a portfolio with 30% ABC Corp and 70% Company B in the table below. (Round to two decimal places) Portfolio Weights Portfolio Average Return Portfolio Standard Deviation WABC Ws ABC - 17.72% 6-12 69% 0.3 0.7 Enter the average return and standard deviation for a portfolio with 20% ABC Corp. and 80% Company B in the table below. (Round to two dec Portfolio Weights Portfolio Average Retur Portfolio Standard Deviation WABC WB ABC = 17 72% 8 = 12.69% 0.2 0.8 Enter the average return and standard deviation for a portfolio with 10% ABC Corp. and 90% Company B in the table below (Round to two decir Portfolio Weights Portfolio Average Return Portfolio Standard Deviation WABC we - 1772% g - 12.69% 0.1 0.9 10% Enter the average return and standard deviation for a portfolio with 0% ABC Corp and 100% Company B in the table below. (Round to two decim Enter Your answer of the answer boxes he icon here in order to copy its contents of the data table belo -heet.) Year 2005 2006 2007 2008 2009 2010 2011 2012 2013 2014 2015 2016 2017 ABC Returns - 5.4% 1.3% - 30.1% - 11.7% 31.6% 25.8% 23.4% 51.1% 36.6% 30.3% 28.6% 4.5% 44.3% B Returns 17.3% - 7.9% - 27.4% - 4.8% 11.2% 9.4% 3.5% 43.7% 41.2% 40.6% 13.3% -0.4% 25.3%


