

Question
The formula contained in the yellow highlighted cell (I39) is = ( , I9,I24). This formula can be copied over to the entire live scenario
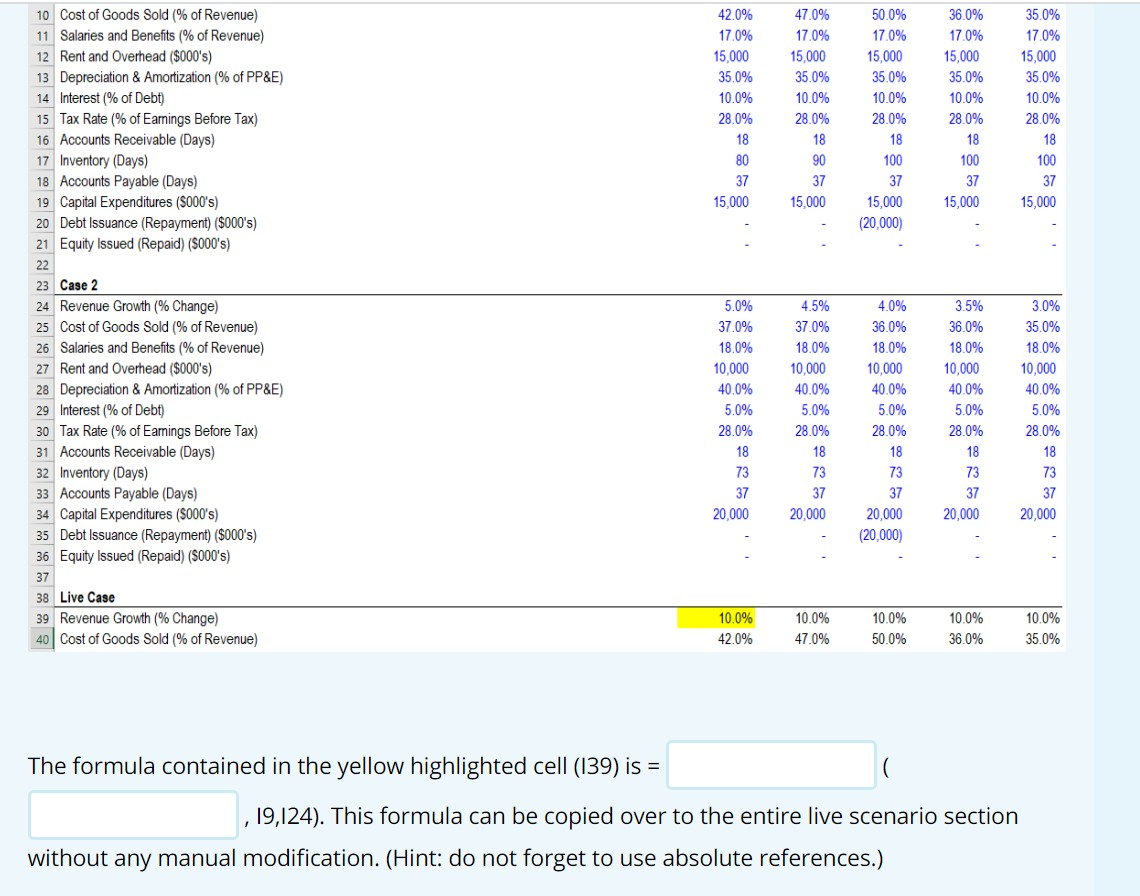
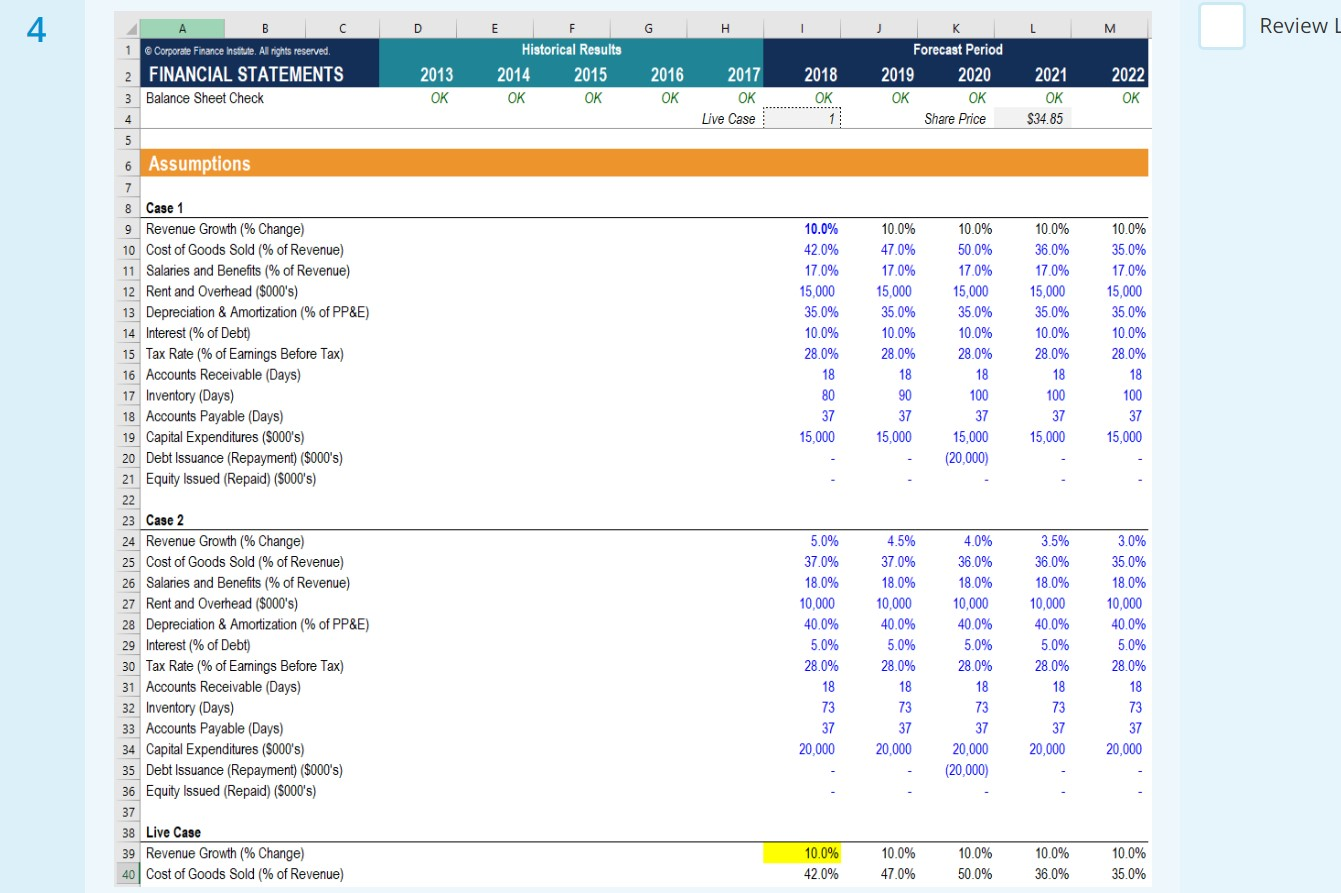
The formula contained in the yellow highlighted cell (I39) is = ( , I9,I24). This formula can be copied over to the entire live scenario section without any manual modification. (Hint: do not forget to use absolute references.)
47.0% 17.0% 15,000 42.0% 17.0% 15,000 35.0% 10.0% 28.0% 18 80 37 15,000 35.0% 10.0% 28.0% 18 90 37 15,000 50.0% 17.0% 15.000 35.0% 10.0% 28.0% 18 100 37 15,000 (20,000 36.0% 17.0% 15,000 35.0% 10.0% 28.0% 18 100 37 15,000 35.0% 17.0% 15,000 35.0% 10.0% 28.0% 18 100 37 15,000 10 Cost of Goods Sold (% of Revenue) 11 Salaries and Benefits (% of Revenue) 12 Rent and Overhead ($000's) 13 Depreciation & Amortization (% of PP&E) 14 Interest (% of Debt) 15 Tax Rate(% of Earnings Before Tax) 16 Accounts Receivable (Days) 17 Inventory (Days) 18 Accounts Payable (Days) 19 Capital Expenditures (S000's) 20 Debt Issuance (Repayment) ($000's) 21 Equity Issued (Repaid) (S000's) 22 23 Case 2 24 Revenue Growth (% Change) 25 Cost of Goods Sold (% of Revenue) 26 Salaries and Benefits (% of Revenue) 27 Rent and Overhead ($000's) 28 Depreciation & Amortization (% of PP&E) 29 Interest (% of Debt) 30 Tax Rate % of Earings Before Tax) 31 Accounts Receivable (Days) 32 Inventory (Days) 33 Accounts Payable (Days) 34 Capital Expenditures (5000's) 35 Debt Issuance (Repayment) ($000's) 36 Equity Issued (Repaid) (S000's) 37 38 Live Case 39 Revenue Growth (% Change) 40 Cost of Goods Sold (% of Revenue) 5.0% 37.0% 18.0% 10,000 40.0% 5.0% 28.0% 18 73 37 20.000 4.5% 37.0% 18.0% 10,000 40.0% 5.0% 28.0% 18 73 37 20,000 4.0% 36.0% 18.0% 10,000 40.0% 5.0% 28.0% 18 73 37 20.000 (20,000) 3.5% 36.0% 18.0% 10,000 40.0% 5.0% 28.0% 18 73 37 20,000 3.0% 35.0% 18.0% 10,000 40.0% 5.0% 28.0% 18 73 37 20,000 10.0% 42.0% 10.0% 47.0% 10.0% 50.0% 10.0% 36.0% 10.0% 35.0% The formula contained in the yellow highlighted cell (139) is = 19,124). This formula can be copied over to the entire live scenario section without any manual modification. (Hint: do not forget to use absolute references.) 4 D G H - - L Review M B 1 @ Corporate Finance Institute. All rights reserved. 2 FINANCIAL STATEMENTS 3 Balance Sheet Check E Historical Results 2014 2015 OK OK 2013 OK 2016 OK 2017 OK Live Case 2018 OK 1 Forecast Period 2019 2020 OK OK Share Price 2021 OK $34.85 2022 OK 4 10.0% 42.0% 17.0% 15,000 35.0% 10.0% 28.0% 18 80 37 15,000 10.0% 47.0% 17.0% 15,000 35.0% 10.0% 28.0% 18 90 37 15,000 10.0% 50.0% 17.0% 15,000 35.0% 10.0% 28.0% 18 100 37 15,000 (20,000) 10.0% 36.0% 17.0% 15,000 35.0% 10.0% 28.0% 18 100 37 15,000 10.0% 35.0% 17.0% 15,000 35.0% 10.0% 28.0% 18 100 37 15,000 5 6 Assumptions 7 8 Case 1 9 Revenue Growth (% Change) 10 Cost of Goods Sold (% of Revenue) 11 Salaries and Benefits % of Revenue) 12 Rent and Overhead ($000's) 13 Depreciation & Amortization (% of PP&E) 14 Interest % of Debt) 15 Tax Rate (% of Eamings Before Tax) 16 Accounts Receivable (Days) 17 Inventory (Days) 18 Accounts Payable (Days) 19 Capital Expenditures (S000's) 20 Debt Issuance (Repayment) ($000's) 21 Equity Issued (Repaid) (S000's) 22 23 Case 2 24 Revenue Growth (% Change) 25 Cost of Goods Sold (% of Revenue) 26 Salaries and Benefits (% of Revenue) 27 Rent and Overhead ($000's) 28 Depreciation & Amortization (% of PP&E) 29 Interest (% of Debt) 30 Tax Rate (% of Eamings Before Tax) 31 Accounts Receivable (Days) 32 Inventory (Days) 33 Accounts Payable (Days) 34 Capital Expenditures (S000's) 35 Debt Issuance (Repayment) ($000's) 36 Equity Issued (Repaid) (5000's) 37 38 Live Case 39 Revenue Growth (% Change) 40 Cost of Goods Sold % of Revenue) 5.0% 37.0% 18.0% 10,000 40.0% 5.0% 28.0% 18 73 37 20,000 4.5% 37.0% 18.0% 10,000 40.0% 5.0% 28.0% 18 73 37 20,000 4.0% 36.0% 18.0% 10,000 40.0% 5.0% 28.0% 18 73 37 20,000 (20,000) 3.5% 36.0% 18.0% 10,000 40.0% 5.0% 28.0% 18 73 37 20,000 3.0% 35.0% 18.0% 10,000 40.0% 5.0% 28.0% 18 73 37 20,000 10.0% 42.0% 10.0% 47.0% 10.0% 50.0% 10.0% 36.0% 10.0% 35.0%Step by Step Solution
There are 3 Steps involved in it
Step: 1

Get Instant Access to Expert-Tailored Solutions
See step-by-step solutions with expert insights and AI powered tools for academic success
Step: 2

Step: 3
Ace Your Homework with AI
Get the answers you need in no time with our AI-driven, step-by-step assistance
Get Started
Sport Funding And Finance
Authors: Bob Stewart
2nd Edition
041583984X, 978-0415839846