

Question
The frequency distribution below represents frequencies of actual low temperatures recorded during the course of a 31 day month Use the frequency distribution to construct

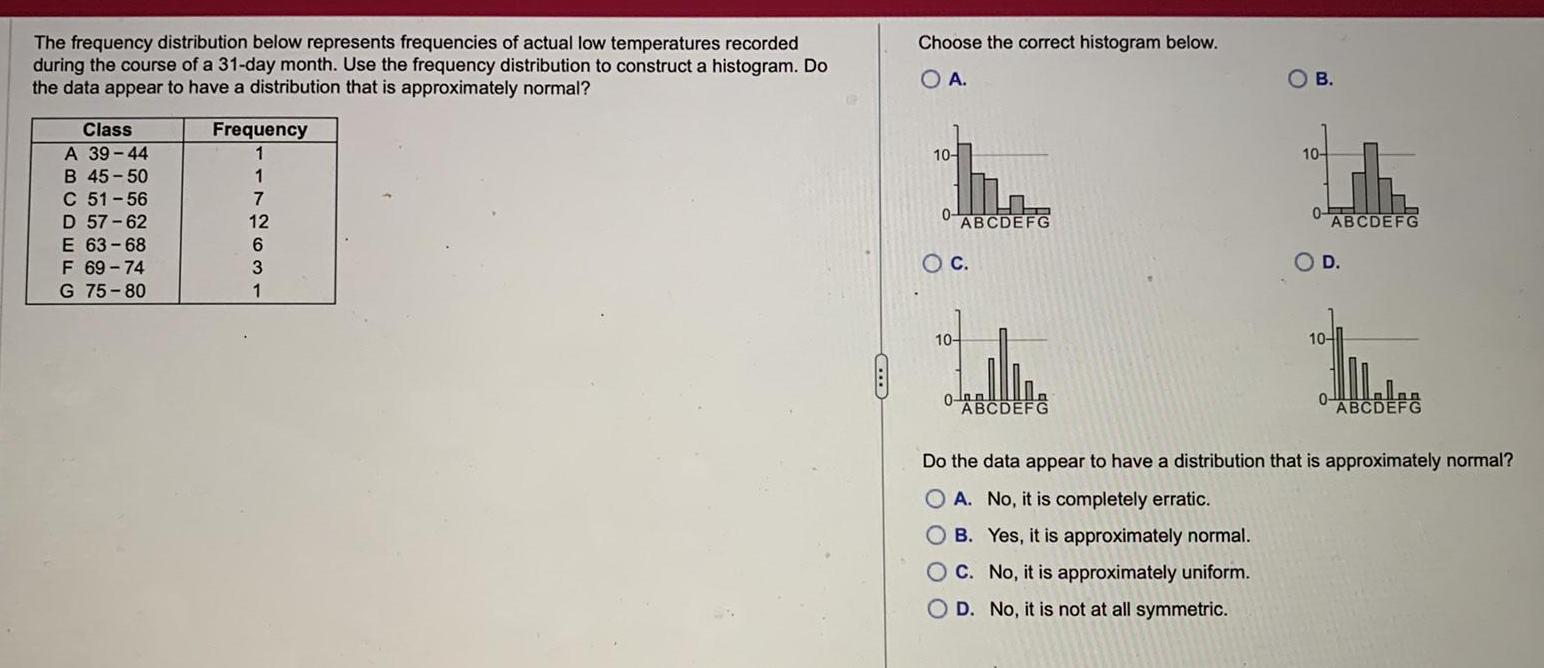
The frequency distribution below represents frequencies of actual low temperatures recorded during the course of a 31 day month Use the frequency distribution to construct a histogram Do the data appear to have a distribution that is approximately normal Class A 39 44 B 45 50 C 51 56 D 57 62 E 63 68 F 69 74 G 75 80 Frequency 1 1 7 12 6 3 1 Choose the correct histogram below O A 10 0 ABCDEFG O C 10 0 p ABCDEFG OB 10 0 ABCDEFG O D 10 Ja ABCDEFG 0 Do the data appear to have a distribution that is approximately normal A No it is completely erratic B Yes it is approximately normal C No it is approximately uniform OD No it is not at all symmetric
Step by Step Solution
There are 3 Steps involved in it
Step: 1

Get Instant Access to Expert-Tailored Solutions
See step-by-step solutions with expert insights and AI powered tools for academic success
Step: 2

Step: 3
Ace Your Homework with AI
Get the answers you need in no time with our AI-driven, step-by-step assistance
Get Started
Textbook Of Co-ordinate Geometry
Authors: Mofidul Islam
1st Edition
9353147824, 9789353147822