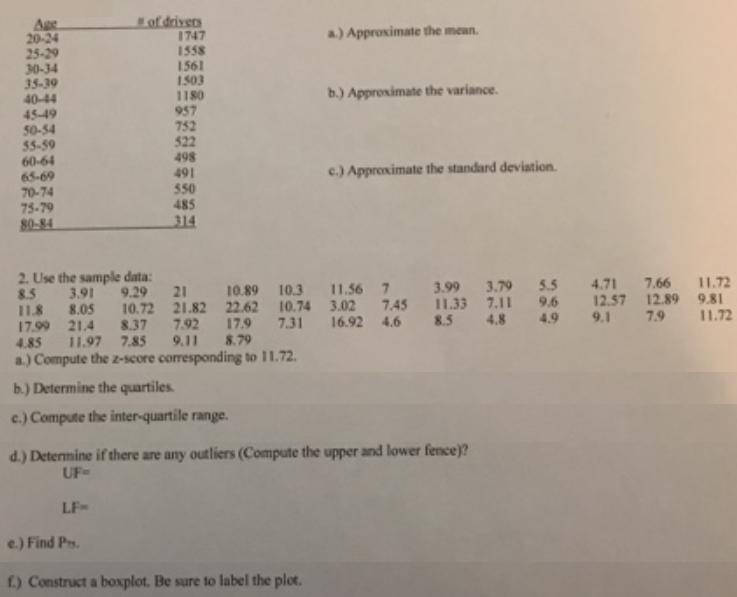
The frequency distribution shown represents the number of drivers in fatal crashes in 1996 for females aged 20 to 84. of drivers 1747 1558 Age
The frequency distribution shown represents the number of drivers in fatal crashes in 1996 for females aged 20 to 84.

of drivers 1747 1558 Age 20-24 25-29 30-34 35-39 40-44 45-49 50-54 55-59 60-64 65-69 70-74 75-79 80-84 a) Approximate the mean. 1561 1503 1180 957 752 522 498 491 b.) Approximate the variance. c.) Approximate the standard deviation. 550 485 314 2. Use the sample data: 3.91 8.05 11.72 9.6 12.57 12.89 9.81 11.72 3.99 3.79 5.5 4.71 7.66 8.5 11.8 17.99 21.4 4.85 a.) Compute the z-score corresponding to 11.72. 10.89 10.3 11.56 7 10.72 21.82 22.62 10.74 3.02 7.45 11.33 7.11 7.31 9.29 21 7.92 17.9 16.92 4.6 8.5 4.8 4.9 9.1 7.9 8.37 11.97 7.85 9.11 8.79 b.) Determine the quartiles. c.) Compute the inter-quartile range. d.) Determine if there are any outliers (Compute the upper and lower fence)? UF- LF- e.) Find Ps. f.) Construct a boxplot. Be sure to label the plot.
Step by Step Solution
3.35 Rating (164 Votes )
There are 3 Steps involved in it
Step: 1
Mid point x Frequency f xf 1xxbar xbar2 fx xbar2 Age 20 24 ...
See step-by-step solutions with expert insights and AI powered tools for academic success
Step: 2

Step: 3

Ace Your Homework with AI
Get the answers you need in no time with our AI-driven, step-by-step assistance
Get Started


