Question
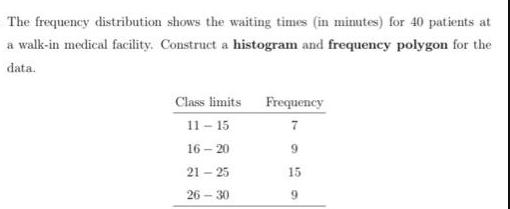
The frequency distribution shows the waiting times (in minutes) for 40 patients at a walk-in medical facility. Construct a histogram and frequency polygon for

The frequency distribution shows the waiting times (in minutes) for 40 patients at a walk-in medical facility. Construct a histogram and frequency polygon for the data. Class limits Frequency 11-15 7 16-20 9 21-25 15 26-30 9
Step by Step Solution
There are 3 Steps involved in it
Step: 1

Get Instant Access to Expert-Tailored Solutions
See step-by-step solutions with expert insights and AI powered tools for academic success
Step: 2

Step: 3

Ace Your Homework with AI
Get the answers you need in no time with our AI-driven, step-by-step assistance
Get StartedRecommended Textbook for
Business Statistics In Practice Using Data Modeling And Analytics
Authors: Bruce L Bowerman, Richard T O'Connell, Emilly S. Murphree
8th Edition
1259549461, 978-1259549465
Students also viewed these Mathematics questions
Question
Answered: 1 week ago
Question
Answered: 1 week ago
Question
Answered: 1 week ago
Question
Answered: 1 week ago
Question
Answered: 1 week ago
Question
Answered: 1 week ago
Question
Answered: 1 week ago
Question
Answered: 1 week ago
Question
Answered: 1 week ago
Question
Answered: 1 week ago
Question
Answered: 1 week ago
Question
Answered: 1 week ago
Question
Answered: 1 week ago
Question
Answered: 1 week ago
Question
Answered: 1 week ago
Question
Answered: 1 week ago
Question
Answered: 1 week ago
Question
Answered: 1 week ago
Question
Answered: 1 week ago
View Answer in SolutionInn App


