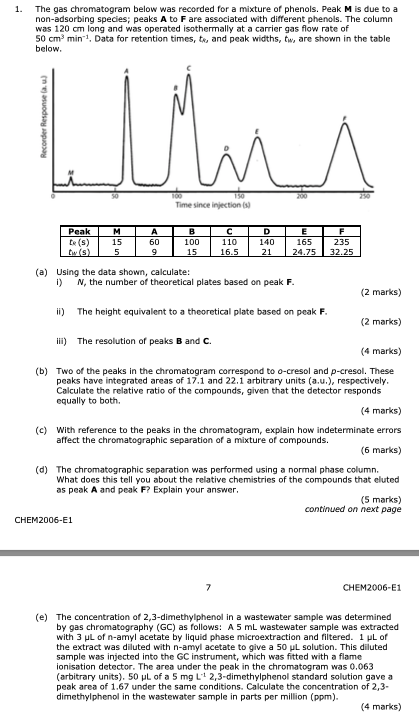
The gas chromatogram below was recorded for a mixture of phenols. Peak M is due to a non-adsorbing species; peaks A to F are associated with different phenols. The column was 120 cm long and was operated isothermally at a carrier gas flow rate of 50 cm
The gas chromatogram below was recorded for a mixture of phenols. Peak M is due to a non-adsorbing species; peaks A to F are associated with different phenols. The column was 120 cm long and was operated isothermally at a carrier gas flow rate of 50 cm3 min1. Data for retention times, tR, and peak widths, tW, are shown in the table below.
3 min1. Data for retention times, tR, and peak widths, tW, are shown in the table below.

1. The gas chromatogram below was recorded for a mixture of phenols, Peak M is due to a non-adsorbing species; peaks A to F are associated with different phenols. The column was 120 cm long and was operated isothermally at a carrier gas flow rate of 50 cm min 1. Data for retention times, ta, and peak widths, tw, are shown in the table below. Recorder Response ) Whis 200 100 Time since injection Peak D M 15 5 A 60 9 B 100 15 110 16.5 140 E 165 24.75 F 235 32.25 21 (a) Using the data shown, calculate: i) N, the number of theoretical plates based on peak F. (2 marks) ii) The height equivalent to a theoretical plate based on peak F. (2 marks) ii) The resolution of peaks B and C. (4 marks) (b) Two of the peaks in the chromatogram correspond to o-cresol and p-cresol. These peaks have integrated areas of 17.1 and 22.1 arbitrary units (a.u.), respectively, Calculate the relative ratio of the compounds, given that the detector responds equally to both. (4 marks) (c) With reference to the peaks in the chromatogram, explain how indeterminate errors affect the chromatographic separation of a mixture of compounds. (6 marks) (d) The chromatographic separation was performed using a normal phase column. What does this tell you about the relative chemistries of the compounds that eluted as peak A and peak F? Explain your answer. (5 marks) continued on next page CHEM2006-E1 CHEM2006-01 (e) The concentration of 2,3-dimethylphenol in a wastewater sample was determined by gas chromatography (GC) as follows: A 5 mL wastewater sample was extracted with 3 L of n-amyl acetate by liquid phase microextraction and filtered. 1 PL of the extract was diluted with n-amyl acetate to give a 50 L solution. This diluted sample was injected into the GC instrument, which was fitted with a flame ionisation detector. The area under the peak in the chromatogram was 0.063 (arbitrary units). 50 L of a 5 mg L 2,3-dimethylphenol standard solution gave a peak area of 1.67 under the same conditions. Calculate the concentration of 2,3- dimethylphenol in the wastewater sample in parts per million (ppm). (4 marks)


