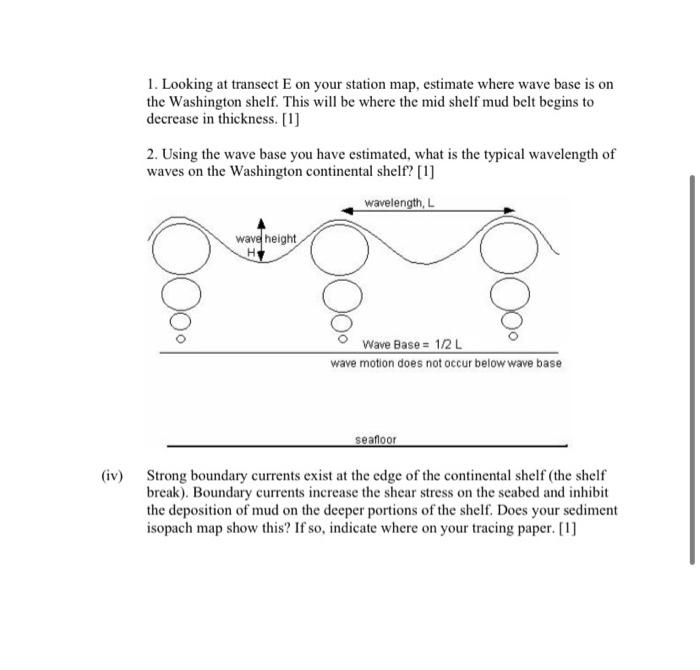
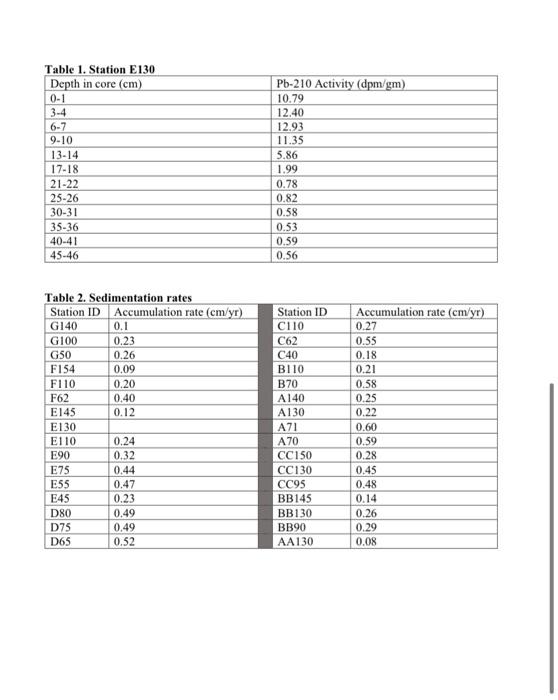
The goal of this lab is to calculate accumulation rates on the Washington continental shelf and then create an isopach map showing those rates. You will then use these findings to predict sediment transport on the shelf. (a) Table 1 contains the 210Pb activity rates of a sediment core (station E130) from the Washington continental shelf. The 210Pb activity of sediment is used as a technique for determining the rate of sediment accumulation. The half-life of 210Pb is 22.3 years, allowing us to date sediments deposited within the last 100 years (approximately five half-lives). (i) Plot the natural log of excess 210Pb activity ( x-axis) versus the midpoint of the depth in core ( y-axis). [1] (ii) Divide your 210Pb profile into three sections (a surface mixed layer, region of radioactive decay, and supported levels of 210Pb ). Label these on your plot. [3] (iii) What is the thickness of the surface mixed layer? What is a potential explanation for the presence of the surface mixed layer? [2] (b) Calculate the sedimentation rate of this profile. Assume steady state and no mixing below the surface mixed layer. [2] (c) Create a sediment isopach map. (i) Overlay tracing paper on the station map. Mark each station and write the accompanying sedimentation rate (from table 2) above each point. Use your calculated sedimentation rate for station E130 from part (b). [1] (ii) Draw contours of equal sedimentation rates using a contour interval of 0.1 cm/yr. [3] (d) Interpreting your sediment isopach map. (i) What is a major supplier of sediments to the Washington shelf? When would you expect the magnitude of this input to be the largest? [2] (ii) What is the general direction of sediment transport on the Washington shelf? [1] (iii) When mud enters the continental shelf system during calm periods, it can be deposited on the shelf. As winter storms arrive, this material is picked up and transported by waves. Waves can resuspend sediment on the seabed when the waves are in shallow enough water to "feel bottom". This depth is known as wave base, and results in waves removing muds from the seabed nearshore. 1. Looking at transect E on your station map, estimate where wave base is on the Washington shelf. This will be where the mid shelf mud belt begins to decrease in thickness. [1] 2. Using the wave base you have estimated, what is the typical wavelength of waves on the Washington continental shelf? [1] seafloor Strong boundary currents exist at the edge of the continental shelf (the shelf break). Boundary currents increase the shear stress on the seabed and inhibit the deposition of mud on the deeper portions of the shelf. Does your sediment isopach map show this? If so, indicate where on your tracing paper. [1] Table 1. Station E130 \begin{tabular}{|l|l|} \hline Depth in core (cm) & Pb-210 Activity (dpm/gm) \\ \hline 01 & 10.79 \\ \hline 34 & 12.40 \\ \hline 67 & 12.93 \\ \hline 910 & 11.35 \\ \hline 1314 & 5.86 \\ \hline 1718 & 1.99 \\ \hline 2122 & 0.78 \\ \hline 2526 & 0.82 \\ \hline 3031 & 0.58 \\ \hline 3536 & 0.53 \\ \hline 4041 & 0.59 \\ \hline 4546 & 0.56 \\ \hline \end{tabular} Table 2. Sedimentation rates \begin{tabular}{|l|l|} \hline Station ID & Accumulation rate (cm/yr) \\ \hline G140 & 0.1 \\ \hline G100 & 0.23 \\ \hline G50 & 0.26 \\ \hline F154 & 0.09 \\ \hline F110 & 0.20 \\ \hline F62 & 0.40 \\ \hline E145 & 0.12 \\ \hline E130 & \\ \hline E110 & 0.24 \\ \hline E90 & 0.32 \\ \hline E75 & 0.44 \\ \hline E55 & 0.47 \\ \hline E45 & 0.23 \\ \hline D80 & 0.49 \\ \hline D75 & 0.49 \\ \hline D65 & 0.52 \\ \hline \end{tabular} \begin{tabular}{|l|l|} \hline Station ID & Accumulation rate (cm/yr) \\ \hline C110 & 0.27 \\ \hline C62 & 0.55 \\ \hline C40 & 0.18 \\ \hline B110 & 0.21 \\ \hline B70 & 0.58 \\ \hline A140 & 0.25 \\ \hline A130 & 0.22 \\ \hline A71 & 0.60 \\ \hline A70 & 0.59 \\ \hline CC150 & 0.28 \\ \hline CC130 & 0.45 \\ \hline CC95 & 0.48 \\ \hline BB145 & 0.14 \\ \hline BB130 & 0.26 \\ \hline BB90 & 0.29 \\ \hline AA130 & 0.08 \\ \hline \end{tabular}


