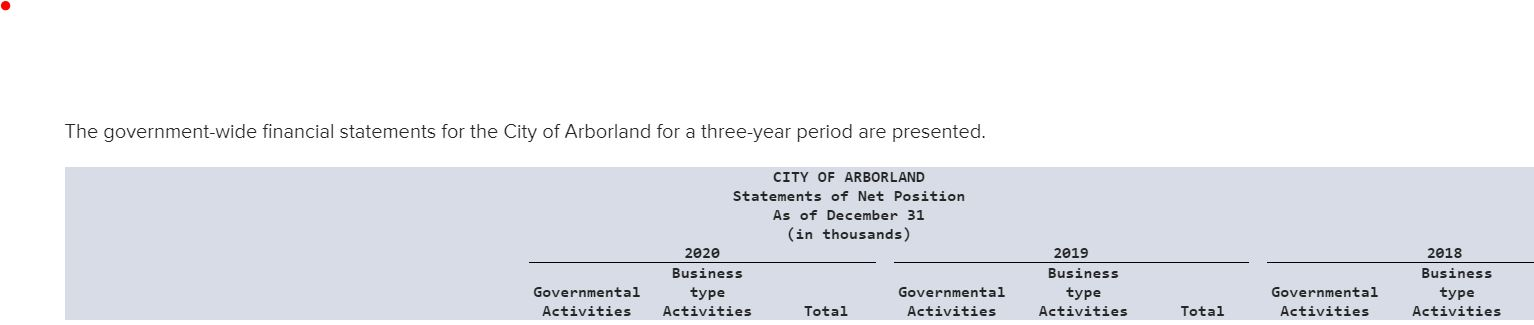
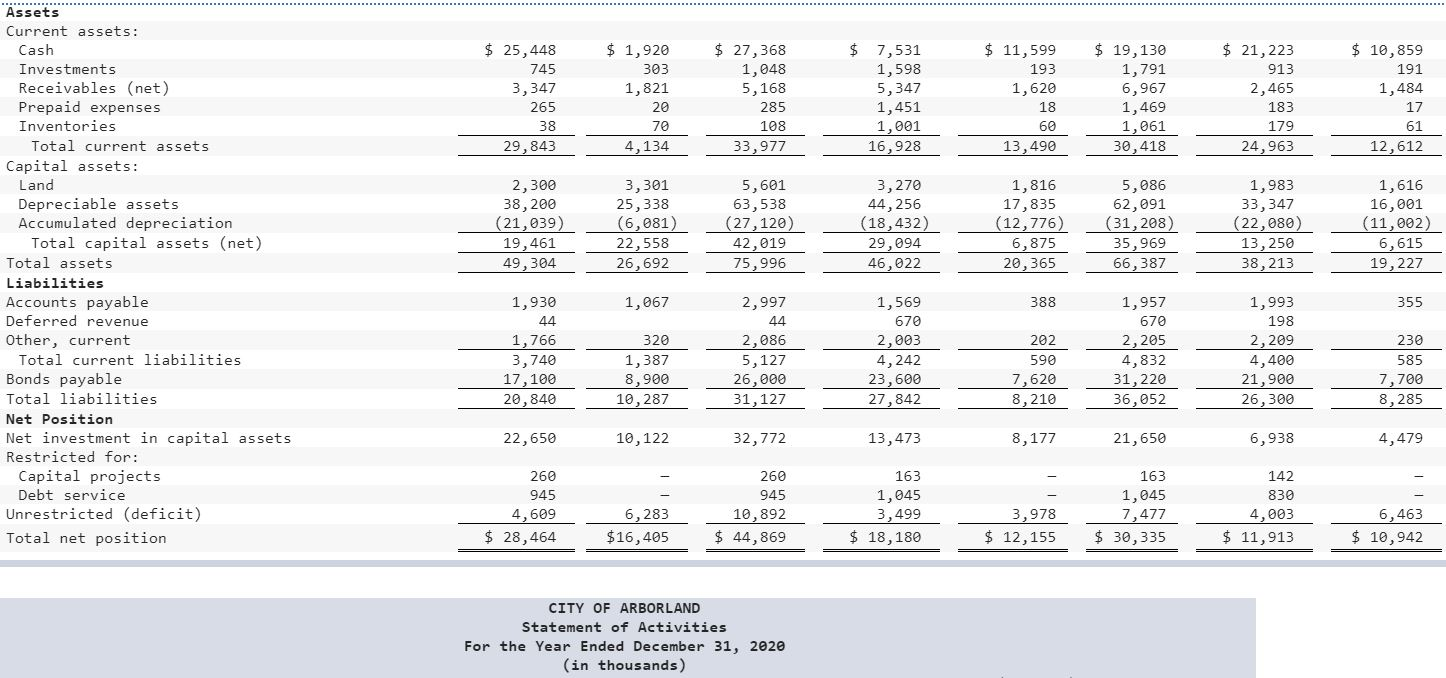
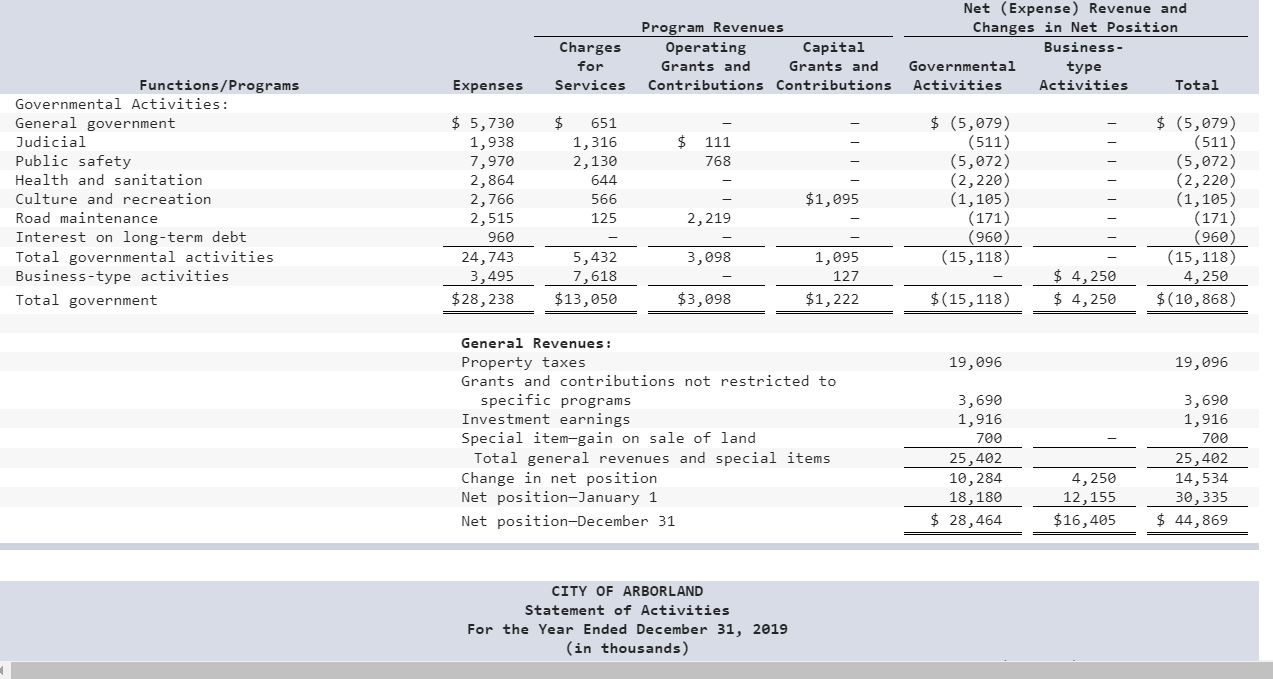
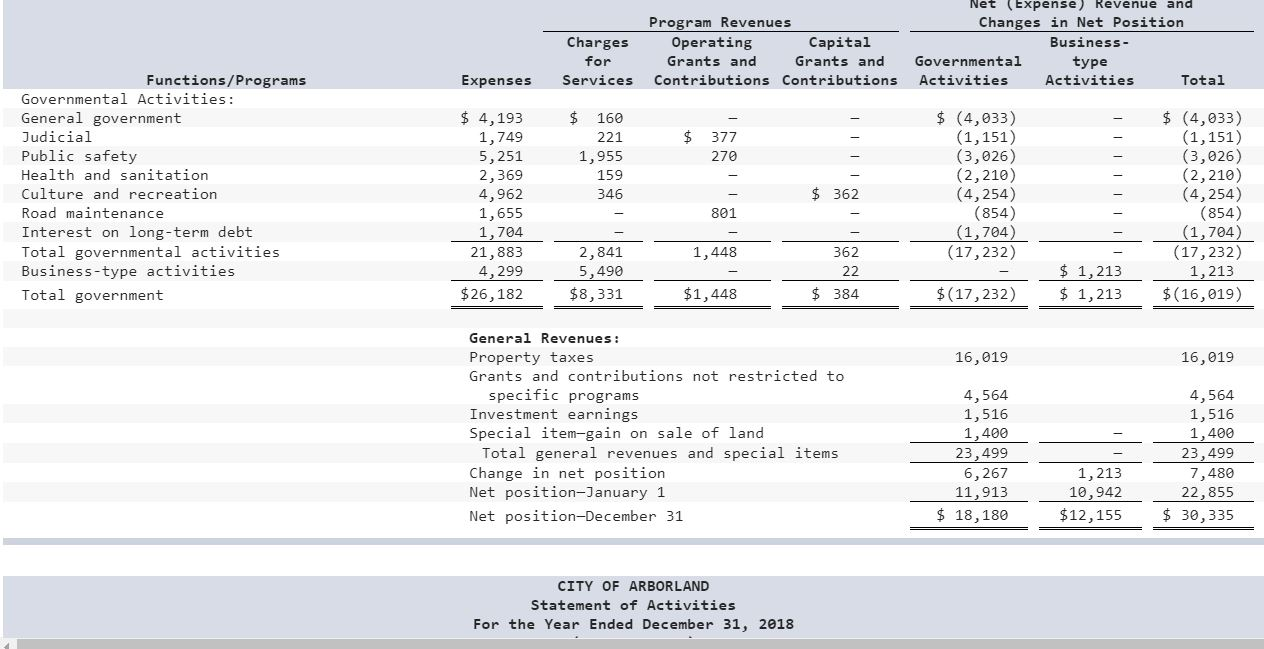
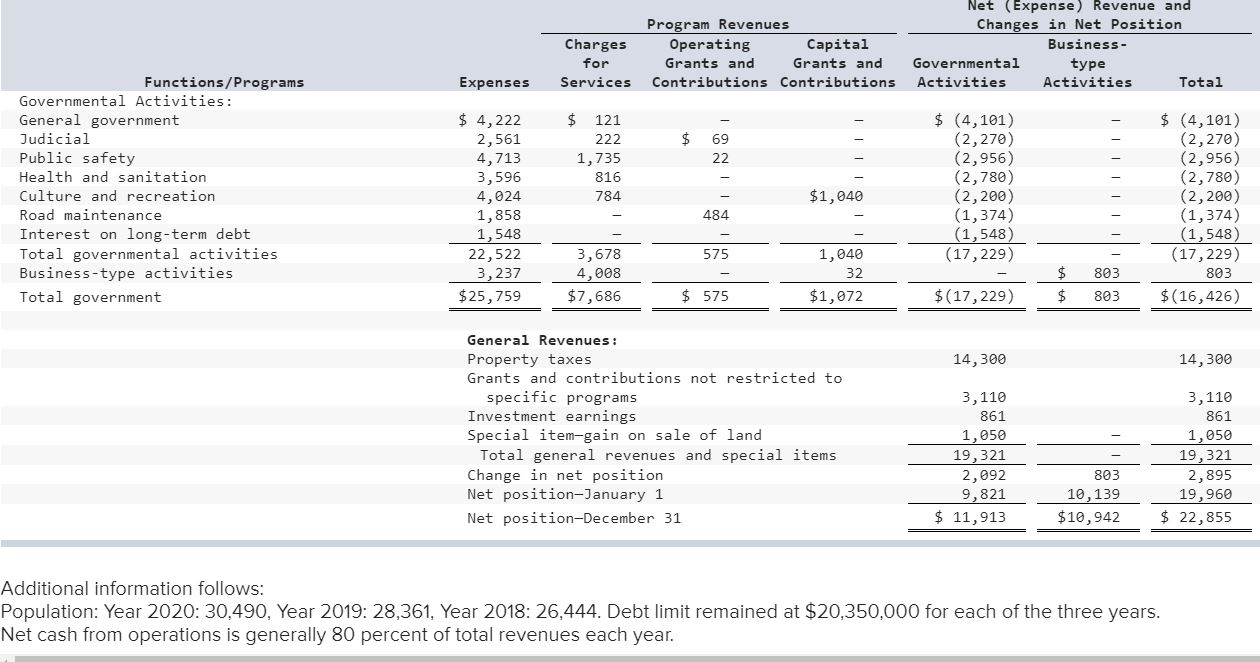
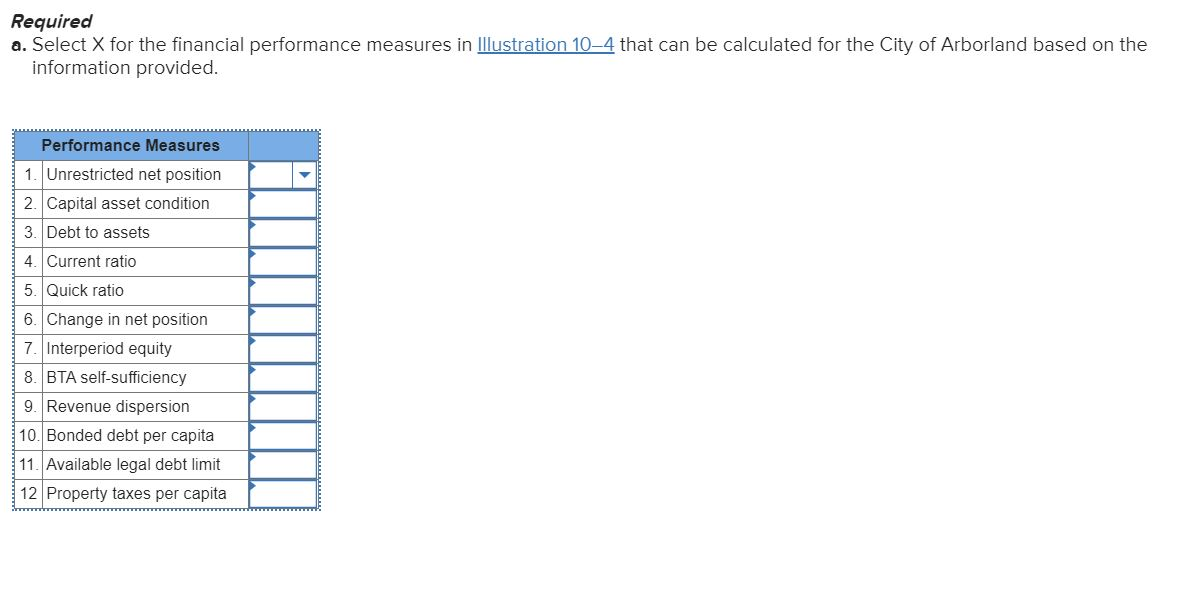
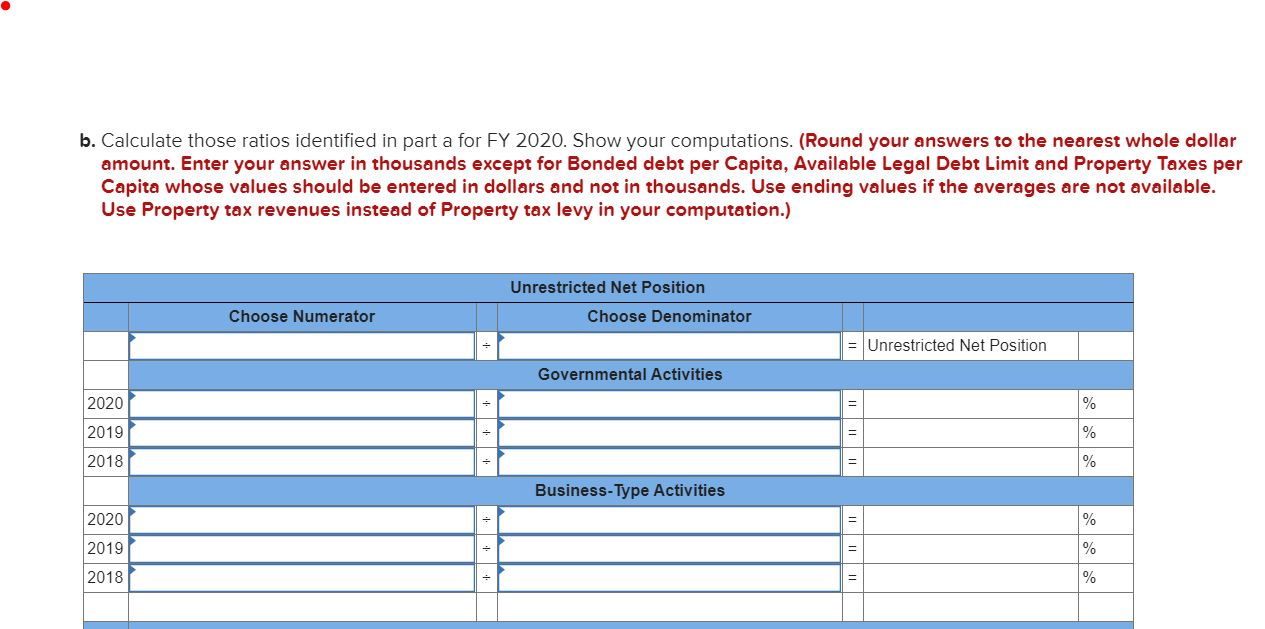
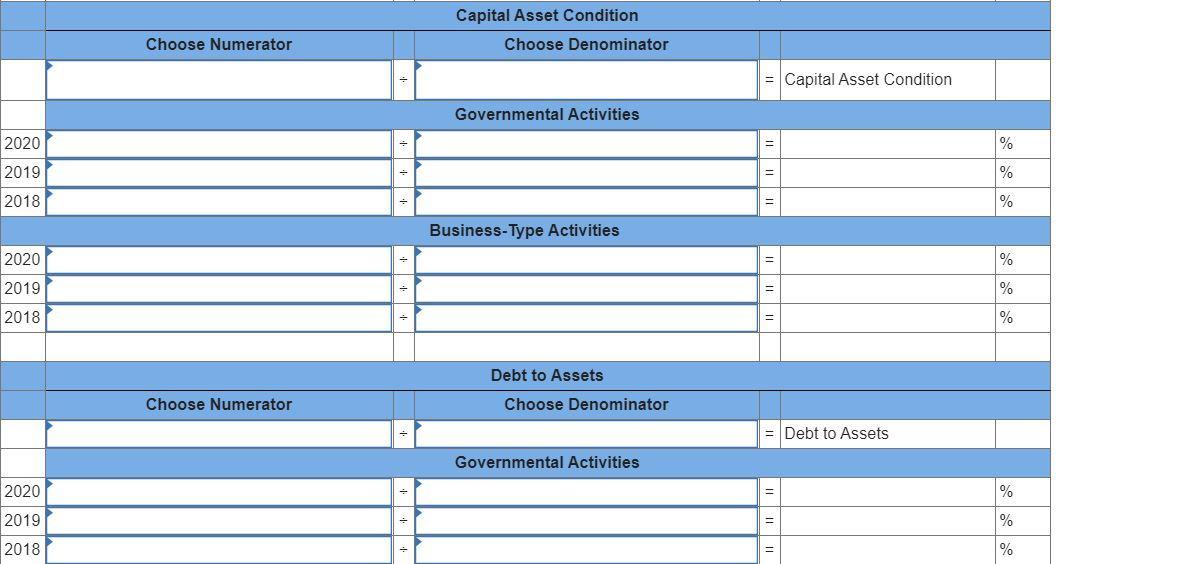
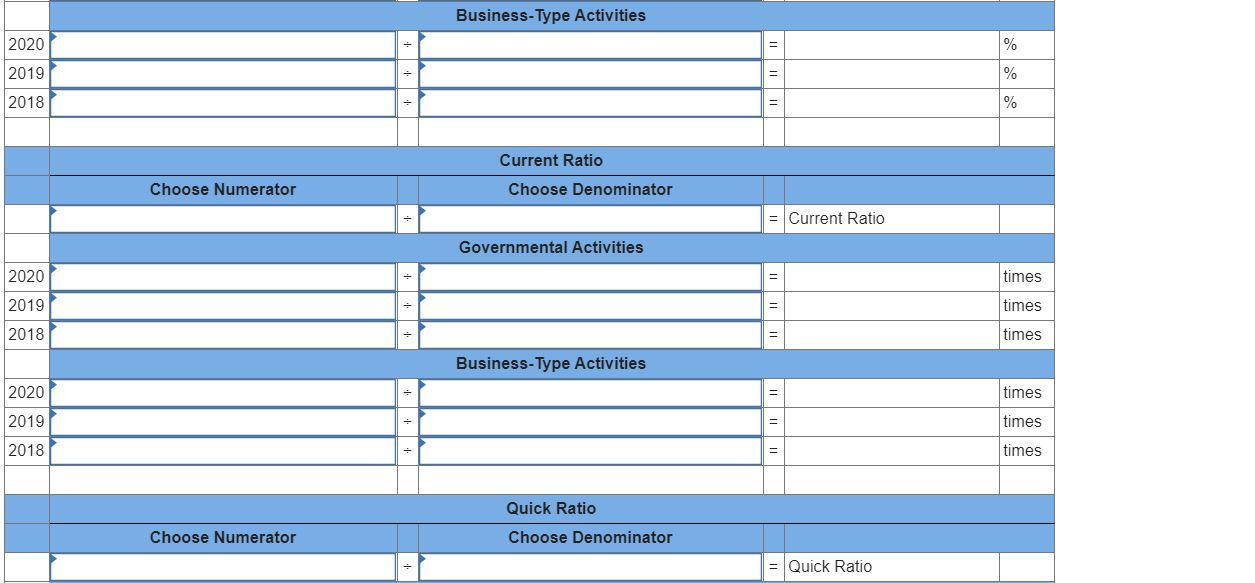
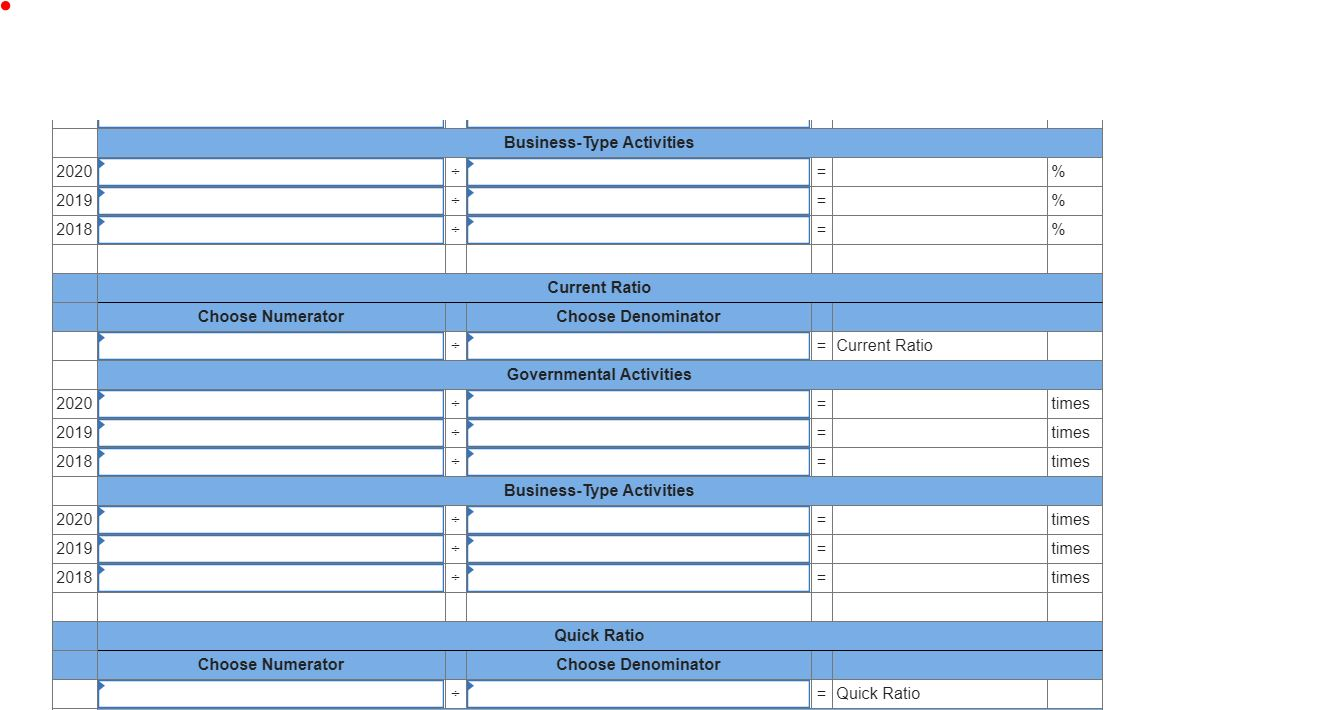
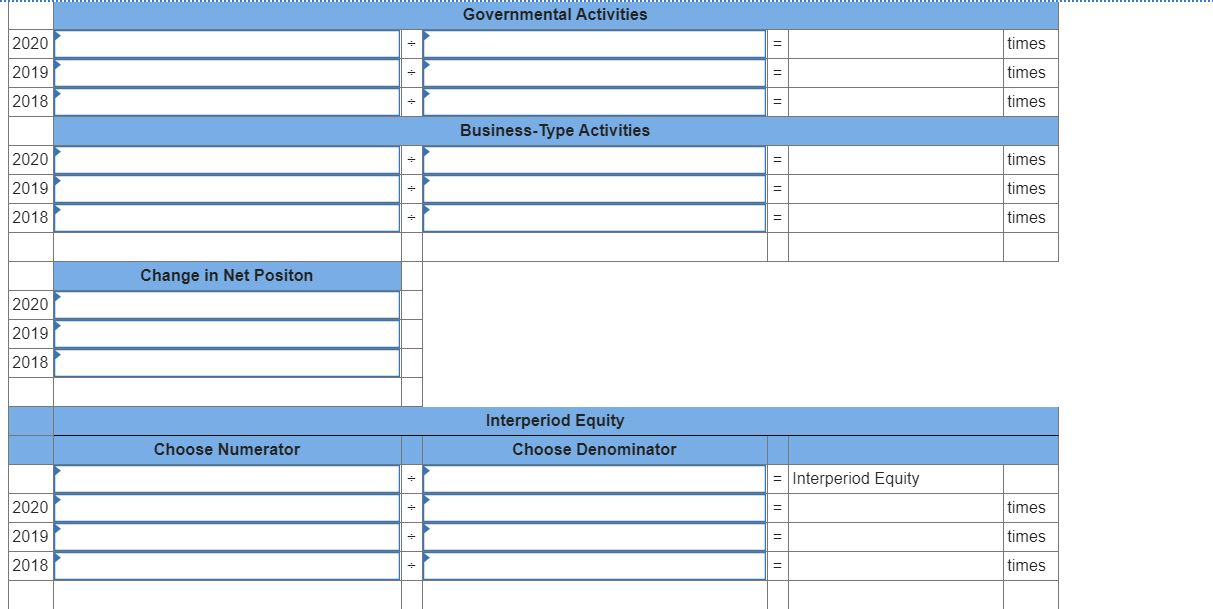
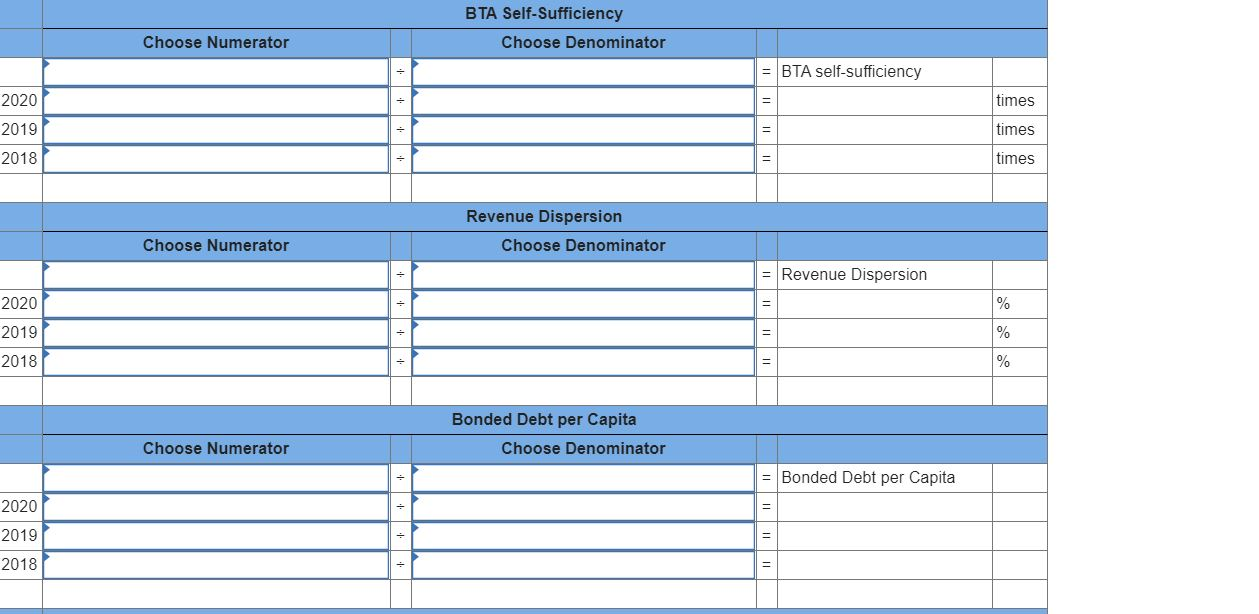
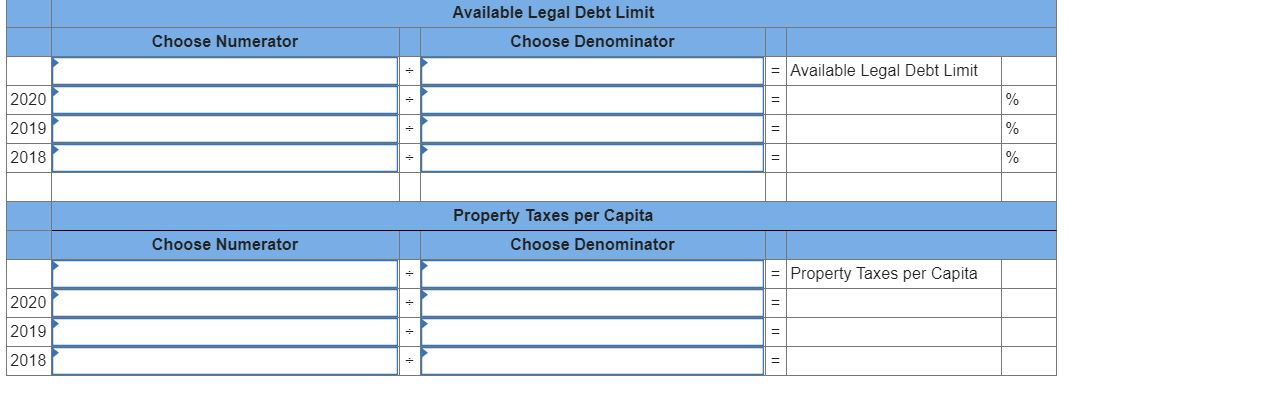
The government-wide financial statements for the City of Arborland for a three-year period are presented. CITY OF ARBORLAND Statements of Net Position As of December 31 (in thousands) 2020 Business type Governmental Activities Total Activities 2019 Business type Activities 2018 Business type Activities Governmental Activities Governmental Activities Total $ $ 11,599 $ 1,920 303 1,821 20 193 $ 25,448 745 3,347 265 38 29,843 $ 27,368 1,048 5,168 285 1,620 7,531 1,598 5,347 1,451 1,001 16,928 $ 19, 130 1,791 6,967 1,469 1,061 30,418 $ 21,223 913 2,465 183 $ 10,859 191 1,484 17 70 108 179 61 4,134 33,977 13,490 24,963 12,612 2,300 38,200 (21,039) 19,461 49,304 3,301 25, 338 (6,081) 22,558 26,692 5,601 63,538 (27,120) 42,019 75,996 3,270 44, 256 (18,432) 29,094 46,022 1,816 17,835 (12,776) 6,875 20,365 5,086 62,091 (31,208) 35,969 66,387 1,983 33,347 (22,080) 13,250 38,213 1,616 16,001 (11,002) 6,615 19,227 Assets Current assets: Cash Investments Receivables (net) Prepaid expenses Inventories Total current assets Capital assets: Land Depreciable assets Accumulated depreciation Total capital assets (net) Total assets Liabilities Accounts payable Deferred revenue Other, current Total current liabilities Bonds payable Total liabilities Net Position Net investment in capital assets Restricted for: Capital projects Debt service Unrestricted (deficit) Total net position 1,067 388 355 1,930 - 44 1,766 3,740 17,100 20,840 320 1,387 8,900 10,287 2,997 - 44 2,086 5,127 26,000 31,127 1,569 670 2,003 4,242 23,600 27,842 202 590 7,620 8,210 1,957 670 2,205 4,832 31,220 36,052 1,993 198 2,209 4,400 21,900 26,300 230 585 7,700 8,285 22,650 10,122 32,772 13,473 8,177 21,650 6,938 4,479 260 945 4,609 $ 28,464 6,283 $16,405 260 945 10,892 $ 44,869 163 1,045 3,499 $ 18,180 3,978 $ 12, 155 163 1,045 7,477 $ 30,335 142 830 4,003 $ 11,913 6,463 $ 10,942 CITY OF ARBORLAND Statement of Activities For the Year Ended December 31, 2020 (in thousands) Program Revenues Charges Operating Capital Grants and Grants and Services Contributions Contributions Net (Expense) Revenue and Changes in Net Position Business- Governmental type Activities Activities Total Expenses $ 1 $ 111 651 1,316 2,130 644 566 768 1 Functions/Programs Governmental Activities: General government Judicial Public safety Health and sanitation Culture and recreation Road maintenance Interest on long-term debt Total governmental activities Business-type activities Total government 1 $1,095 $ 5,730 1,938 7,970 2,864 2,766 2,515 960 24,743 3,495 $28,238 $ (5, 079) (511) (5,072) (2,220) (1,105) (171) (960) (15,118) IlIIIIII 125 2,219 $ (5,079) (511) (5,072) (2,220) (1,105) (171) (960) (15,118) 4,250 $(10,868) 3,098 5,432 7,618 $13,050 1,095 127 $1,222 $ 4,250 $ 4,250 $3,098 $(15,118) 19,096 19,096 General Revenues: Property taxes Grants and contributions not restricted to specific programs Investment earnings Special item-gain on sale of land Total general revenues and special items Change in net position Net position-January 1 Net position-December 31 3,690 1,916 700 25,402 10,284 18,180 $ 28,464 3,690 1,916 700 25,402 14,534 30,335 $ 44,869 4,250 12,155 $16,405 CITY OF ARBORLAND Statement of Activities For the Year Ended December 31, 2019 (in thousands) Net (Expense) Revenue and Program Revenues Changes in Net Position Charges Operating Capital Business- for Grants and Grants and Governmental type Services Contributions Contributions Activities Activities Total Expenses $ Functions/Programs Governmental Activities: General government Judicial Public safety Health and sanitation Culture and recreation Road maintenance Interest on long-term debt Total governmental activities Business-type activities Total government $ 160 221 1,955 159 346 377 270 $ 4,193 1,749 5, 251 2,369 4,962 1,655 1,704 21,883 4,299 $26,182 $ 362 $ (4,033) (1,151) (3,026) (2,210) (4,254) (854) (1,704) (17,232) IIIIII 801 $ (4,033) (1,151) (3,026) (2,210) (4,254) (854) (1,704) (17,232) 1, 213 $(16,019) 1,448 362 2,841 5,490 $8,331 22 $ 1,213 $ 1,213 $1,448 $ 384 $(17,232) 16,019 16,019 General Revenues : Property taxes Grants and contributions not restricted to specific programs Investment earnings Special item-gain on sale of land Total general revenues and special items Change in net position Net position-January 1 Net position-December 31 11 4,564 1,516 1,400 23,499 6,267 11,913 $ 18,180 4,564 1,516 1,400 23,499 7,480 22,855 $ 30,335 1,213 10,942 $12, 155 CITY OF ARBORLAND Statement of Activities For the Year Ended December 31, 2018 Program Revenues Charges Operating Capital for Grants and Grants and Services Contributions Contributions Net (Expense) Revenue and Changes in Net Position Business- Governmental type Activities Activities Total Expenses $ 121 222 1,735 $ 69 Functions/Programs Governmental Activities: General government Judicial Public safety Health and sanitation Culture and recreation Road maintenance Interest on long-term debt Total governmental activities Business-type activities Total government 784 $ 4,222 2,561 4,713 3,596 4,024 1,858 1,548 22,522 3,237 $25,759 IIIIIII $1,040 $ (4,101) (2,270) (2,956) (2,780) (2,200) (1,374) (1,548) (17,229) _ $(17,229) II $ (4,101) (2,270) (2,956) (2,780) (2,200) (1,374) (1,548) (17,229) 803 $(16,426) 575 3,678 4,008 $7,686 1,040 32 $1,072 $ $ 803 803 $ 575 14,300 14,300 General Revenues : Property taxes Grants and contributions not restricted to specific programs Investment earnings Special item-gain on sale of land Total general revenues and special items Change in net position Net position-January 1 Net position-December 31 3,110 861 1,050 19,321 2,092 9,821 $ 11,913 3,110 861 1,050 19,321 2,895 19,960 $ 22,855 803 10,139 $10,942 Additional information follows: Population: Year 2020:30,490, Year 2019: 28,361, Year 2018: 26,444. Debt limit remained at $20,350,000 for each of the three years. Net cash from operations is generally 80 percent of total revenues each year. Required a. Select X for the financial performance measures in Illustration 10_4 that can be calculated for the City of Arborland based on the information provided. Performance Measures 1. Unrestricted net position 2. Capital asset condition 3. Debt to assets 4. Current ratio 5. Quick ratio 6. Change in net position 7. Interperiod equity 8. BTA self-sufficiency 9. Revenue dispersion 10. Bonded debt per capita 11. Available legal debt limit 12 Property taxes per capita b. Calculate those ratios identified in part a for FY 2020. Show your computations. (Round your answers to the nearest whole dollar amount. Enter your answer in thousands except for Bonded debt per Capita, Available Legal Debt Limit and Property Taxes per Capita whose values should be entered in dollars and not in thousands. Use ending values if the averages are not available. Use Property tax revenues instead of Property tax levy in your computation.) Unrestricted Net Position Choose Denominator Choose Numerator Unrestricted Net Position Governmental Activities 2020 + 2019 2018 Business-Type Activities 2020 2019 2018 Capital Asset Condition Choose Denominator Choose Numerator Capital Asset Condition Governmental Activities 11 2020 2019 2018 = - Business-Type Activities 2020 2019 2018 Debt to Assets Choose Denominator Choose Numerator arator Debt to Assets Governmental Activities 2020 2019 2018 Business-Type Activities 2020 2019 2018 Current Ratio Choose Numerator Choose Denominator Current Ratio Governmental Activities times 2020 2019 2018 times times - Business-Type Activities 2020 2019 2018/ times times times Choose Numerator Quick Ratio Choose Denominator = Quick Ratio Business-Type Activities 2020 2019 2018/ Current Ratio Choose Denominator Choose Numerator = Current Ratio Governmental Activities + times 2020 2019 2018 times times Business-Type Activities times 2020 2019 2018 times times Quick Ratio Choose Denominator Choose Numerator Quick Ratio Governmental Activities times 2020 2019 2018 times times Business-Type Activities = times 2020 2019 2018 times = = times Change in Net Positon 2020 2019 2018 Interperiod Equity Choose Denominator Choose Numerator = Interperiod Equity times 2020 2019 2018 times times BTA Self-Sufficiency Choose Denominator Choose Numerator BTA self-sufficiency 11 2020 2019 2018 = 1 = times times times = Revenue Dispersion Choose Denominator Choose Numerator 2020 2019 2018 Revenue Dispersion = = = L Bonded Debt per Capita Choose Denominator Choose Numerator = Bonded Debt per Capita 2020 2019 2018 1111 Available Legal Debt Limit Choose Denominator Choose Numerator = Available Legal Debt Limit 2020 2019 2018 Property Taxes per Capita Choose Denominator Choose Numerator = Property Taxes per Capita II 2020 2019 2018 II II The government-wide financial statements for the City of Arborland for a three-year period are presented. CITY OF ARBORLAND Statements of Net Position As of December 31 (in thousands) 2020 Business type Governmental Activities Total Activities 2019 Business type Activities 2018 Business type Activities Governmental Activities Governmental Activities Total $ $ 11,599 $ 1,920 303 1,821 20 193 $ 25,448 745 3,347 265 38 29,843 $ 27,368 1,048 5,168 285 1,620 7,531 1,598 5,347 1,451 1,001 16,928 $ 19, 130 1,791 6,967 1,469 1,061 30,418 $ 21,223 913 2,465 183 $ 10,859 191 1,484 17 70 108 179 61 4,134 33,977 13,490 24,963 12,612 2,300 38,200 (21,039) 19,461 49,304 3,301 25, 338 (6,081) 22,558 26,692 5,601 63,538 (27,120) 42,019 75,996 3,270 44, 256 (18,432) 29,094 46,022 1,816 17,835 (12,776) 6,875 20,365 5,086 62,091 (31,208) 35,969 66,387 1,983 33,347 (22,080) 13,250 38,213 1,616 16,001 (11,002) 6,615 19,227 Assets Current assets: Cash Investments Receivables (net) Prepaid expenses Inventories Total current assets Capital assets: Land Depreciable assets Accumulated depreciation Total capital assets (net) Total assets Liabilities Accounts payable Deferred revenue Other, current Total current liabilities Bonds payable Total liabilities Net Position Net investment in capital assets Restricted for: Capital projects Debt service Unrestricted (deficit) Total net position 1,067 388 355 1,930 - 44 1,766 3,740 17,100 20,840 320 1,387 8,900 10,287 2,997 - 44 2,086 5,127 26,000 31,127 1,569 670 2,003 4,242 23,600 27,842 202 590 7,620 8,210 1,957 670 2,205 4,832 31,220 36,052 1,993 198 2,209 4,400 21,900 26,300 230 585 7,700 8,285 22,650 10,122 32,772 13,473 8,177 21,650 6,938 4,479 260 945 4,609 $ 28,464 6,283 $16,405 260 945 10,892 $ 44,869 163 1,045 3,499 $ 18,180 3,978 $ 12, 155 163 1,045 7,477 $ 30,335 142 830 4,003 $ 11,913 6,463 $ 10,942 CITY OF ARBORLAND Statement of Activities For the Year Ended December 31, 2020 (in thousands) Program Revenues Charges Operating Capital Grants and Grants and Services Contributions Contributions Net (Expense) Revenue and Changes in Net Position Business- Governmental type Activities Activities Total Expenses $ 1 $ 111 651 1,316 2,130 644 566 768 1 Functions/Programs Governmental Activities: General government Judicial Public safety Health and sanitation Culture and recreation Road maintenance Interest on long-term debt Total governmental activities Business-type activities Total government 1 $1,095 $ 5,730 1,938 7,970 2,864 2,766 2,515 960 24,743 3,495 $28,238 $ (5, 079) (511) (5,072) (2,220) (1,105) (171) (960) (15,118) IlIIIIII 125 2,219 $ (5,079) (511) (5,072) (2,220) (1,105) (171) (960) (15,118) 4,250 $(10,868) 3,098 5,432 7,618 $13,050 1,095 127 $1,222 $ 4,250 $ 4,250 $3,098 $(15,118) 19,096 19,096 General Revenues: Property taxes Grants and contributions not restricted to specific programs Investment earnings Special item-gain on sale of land Total general revenues and special items Change in net position Net position-January 1 Net position-December 31 3,690 1,916 700 25,402 10,284 18,180 $ 28,464 3,690 1,916 700 25,402 14,534 30,335 $ 44,869 4,250 12,155 $16,405 CITY OF ARBORLAND Statement of Activities For the Year Ended December 31, 2019 (in thousands) Net (Expense) Revenue and Program Revenues Changes in Net Position Charges Operating Capital Business- for Grants and Grants and Governmental type Services Contributions Contributions Activities Activities Total Expenses $ Functions/Programs Governmental Activities: General government Judicial Public safety Health and sanitation Culture and recreation Road maintenance Interest on long-term debt Total governmental activities Business-type activities Total government $ 160 221 1,955 159 346 377 270 $ 4,193 1,749 5, 251 2,369 4,962 1,655 1,704 21,883 4,299 $26,182 $ 362 $ (4,033) (1,151) (3,026) (2,210) (4,254) (854) (1,704) (17,232) IIIIII 801 $ (4,033) (1,151) (3,026) (2,210) (4,254) (854) (1,704) (17,232) 1, 213 $(16,019) 1,448 362 2,841 5,490 $8,331 22 $ 1,213 $ 1,213 $1,448 $ 384 $(17,232) 16,019 16,019 General Revenues : Property taxes Grants and contributions not restricted to specific programs Investment earnings Special item-gain on sale of land Total general revenues and special items Change in net position Net position-January 1 Net position-December 31 11 4,564 1,516 1,400 23,499 6,267 11,913 $ 18,180 4,564 1,516 1,400 23,499 7,480 22,855 $ 30,335 1,213 10,942 $12, 155 CITY OF ARBORLAND Statement of Activities For the Year Ended December 31, 2018 Program Revenues Charges Operating Capital for Grants and Grants and Services Contributions Contributions Net (Expense) Revenue and Changes in Net Position Business- Governmental type Activities Activities Total Expenses $ 121 222 1,735 $ 69 Functions/Programs Governmental Activities: General government Judicial Public safety Health and sanitation Culture and recreation Road maintenance Interest on long-term debt Total governmental activities Business-type activities Total government 784 $ 4,222 2,561 4,713 3,596 4,024 1,858 1,548 22,522 3,237 $25,759 IIIIIII $1,040 $ (4,101) (2,270) (2,956) (2,780) (2,200) (1,374) (1,548) (17,229) _ $(17,229) II $ (4,101) (2,270) (2,956) (2,780) (2,200) (1,374) (1,548) (17,229) 803 $(16,426) 575 3,678 4,008 $7,686 1,040 32 $1,072 $ $ 803 803 $ 575 14,300 14,300 General Revenues : Property taxes Grants and contributions not restricted to specific programs Investment earnings Special item-gain on sale of land Total general revenues and special items Change in net position Net position-January 1 Net position-December 31 3,110 861 1,050 19,321 2,092 9,821 $ 11,913 3,110 861 1,050 19,321 2,895 19,960 $ 22,855 803 10,139 $10,942 Additional information follows: Population: Year 2020:30,490, Year 2019: 28,361, Year 2018: 26,444. Debt limit remained at $20,350,000 for each of the three years. Net cash from operations is generally 80 percent of total revenues each year. Required a. Select X for the financial performance measures in Illustration 10_4 that can be calculated for the City of Arborland based on the information provided. Performance Measures 1. Unrestricted net position 2. Capital asset condition 3. Debt to assets 4. Current ratio 5. Quick ratio 6. Change in net position 7. Interperiod equity 8. BTA self-sufficiency 9. Revenue dispersion 10. Bonded debt per capita 11. Available legal debt limit 12 Property taxes per capita b. Calculate those ratios identified in part a for FY 2020. Show your computations. (Round your answers to the nearest whole dollar amount. Enter your answer in thousands except for Bonded debt per Capita, Available Legal Debt Limit and Property Taxes per Capita whose values should be entered in dollars and not in thousands. Use ending values if the averages are not available. Use Property tax revenues instead of Property tax levy in your computation.) Unrestricted Net Position Choose Denominator Choose Numerator Unrestricted Net Position Governmental Activities 2020 + 2019 2018 Business-Type Activities 2020 2019 2018 Capital Asset Condition Choose Denominator Choose Numerator Capital Asset Condition Governmental Activities 11 2020 2019 2018 = - Business-Type Activities 2020 2019 2018 Debt to Assets Choose Denominator Choose Numerator arator Debt to Assets Governmental Activities 2020 2019 2018 Business-Type Activities 2020 2019 2018 Current Ratio Choose Numerator Choose Denominator Current Ratio Governmental Activities times 2020 2019 2018 times times - Business-Type Activities 2020 2019 2018/ times times times Choose Numerator Quick Ratio Choose Denominator = Quick Ratio Business-Type Activities 2020 2019 2018/ Current Ratio Choose Denominator Choose Numerator = Current Ratio Governmental Activities + times 2020 2019 2018 times times Business-Type Activities times 2020 2019 2018 times times Quick Ratio Choose Denominator Choose Numerator Quick Ratio Governmental Activities times 2020 2019 2018 times times Business-Type Activities = times 2020 2019 2018 times = = times Change in Net Positon 2020 2019 2018 Interperiod Equity Choose Denominator Choose Numerator = Interperiod Equity times 2020 2019 2018 times times BTA Self-Sufficiency Choose Denominator Choose Numerator BTA self-sufficiency 11 2020 2019 2018 = 1 = times times times = Revenue Dispersion Choose Denominator Choose Numerator 2020 2019 2018 Revenue Dispersion = = = L Bonded Debt per Capita Choose Denominator Choose Numerator = Bonded Debt per Capita 2020 2019 2018 1111 Available Legal Debt Limit Choose Denominator Choose Numerator = Available Legal Debt Limit 2020 2019 2018 Property Taxes per Capita Choose Denominator Choose Numerator = Property Taxes per Capita II 2020 2019 2018