Answered step by step
Verified Expert Solution
Question
1 Approved Answer
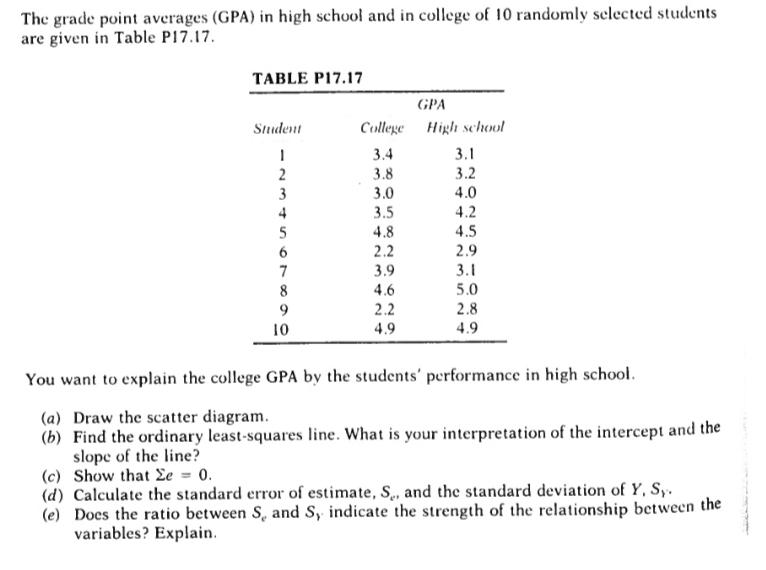
The grade point averages (GPA) in high school and in college of 10 randomly selected students are given in Table P17.17. TABLE P17.17 Student

The grade point averages (GPA) in high school and in college of 10 randomly selected students are given in Table P17.17. TABLE P17.17 Student -234567890 10 GPA College High school 3.4 3.1 3.8 3.2 3.0 4.0 3.5 4.2 4.8 4.5 2.2 2.9 3.9 3.1 4.6 5.0 2.2 2.8 4.9 4.9 You want to explain the college GPA by the students' performance in high school. (a) Draw the scatter diagram. (b) Find the ordinary least-squares line. What is your interpretation of the intercept and the slope of the line? (c) Show that e = 0. (d) Calculate the standard error of estimate, S., and the standard deviation of Y, Sy. (e) Does the ratio between S, and S, indicate the strength of the relationship between the variables? Explain.
Step by Step Solution
There are 3 Steps involved in it
Step: 1
To solve this problem well perform the following steps 1 Create lists to store the high school GPA and college GPA data 2 Calculate the sum of each li...
Get Instant Access to Expert-Tailored Solutions
See step-by-step solutions with expert insights and AI powered tools for academic success
Step: 2

Step: 3

Ace Your Homework with AI
Get the answers you need in no time with our AI-driven, step-by-step assistance
Get Started


