

Answered step by step
Verified Expert Solution
Question
1 Approved Answer
The graph at the top are the numbers being gives. on our direction to follow there was a step that mention to arrange the mass
The graph at the top are the numbers being gives. on our direction to follow there was a step that mention to arrange the mass and density number from small to big. Once you do that the graph changes drastically. please help
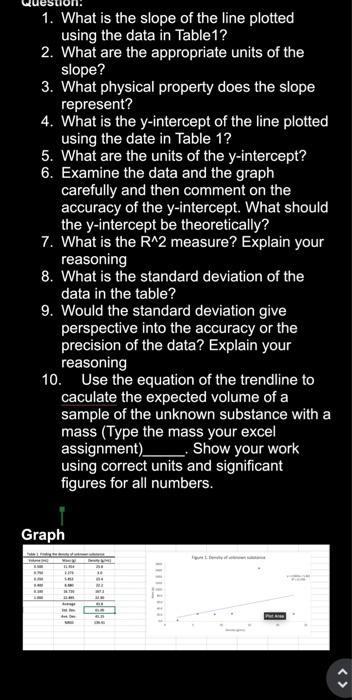
Data table: Excel Exercise w2022 Code - 200 Volume (ml) 0.500 0.750 0.250 0.400 0.100 1.000 Mass) 11.914 16.720 5.852 8.880 2.273 22.895 Q7. masse) = 10.571 Question: 1. What is the slope of the line plotted using the data in Table1? 2. What are the appropriate units of the slope? 3. What physical property does the slope represent? 4. What is the y-intercept of the line plotted using the date in Table 1? 5. What are the units of the y-intercept? 6. Examine the data and the graph carefully and then comment on the accuracy of the y-intercept. What should the y-intercept be theoretically? 7. What is the R^2 measure? Explain your reasoning 8. What is the standard deviation of the data in the table? 9. Would the standard deviation give perspective into the accuracy or the 1. What is the slope of the line plotted using the data in Table 1? 2. What are the appropriate units of the slope? 3. What physical property does the slope represent? 4. What is the y-intercept of the line plotted using the date in Table 1? 5. What are the units of the y-intercept? 6. Examine the data and the graph carefully and then comment on the accuracy of the y-intercept. What should the y-intercept be theoretically? 7. What is the R^2 measure? Explain your reasoning 8. What is the standard deviation of the data in the table? 9. Would the standard deviation give perspective into the accuracy or the precision of the data? Explain your reasoning 10. Use the equation of the trendline to caculate the expected volume of a sample of the unknown substance with a mass (Type the mass your excel assignment) _ Show your work using correct units and significant figures for all numbers. Graph 10 NE 11111111 if you need the directions, please let me know. thank you 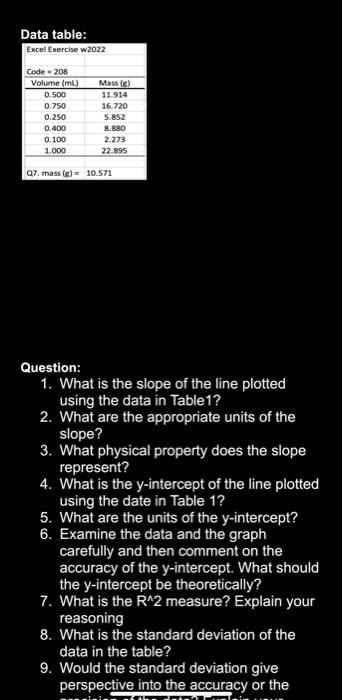
Step by Step Solution
There are 3 Steps involved in it
Step: 1

Get Instant Access to Expert-Tailored Solutions
See step-by-step solutions with expert insights and AI powered tools for academic success
Step: 2

Step: 3
Ace Your Homework with AI
Get the answers you need in no time with our AI-driven, step-by-step assistance
Get Started
Introduction to Chemical Engineering Thermodynamics
Authors: J. M. Smith, H. C. Van Ness, M. M. Abbott
7th edition
71247084, 978-0071247085