Question
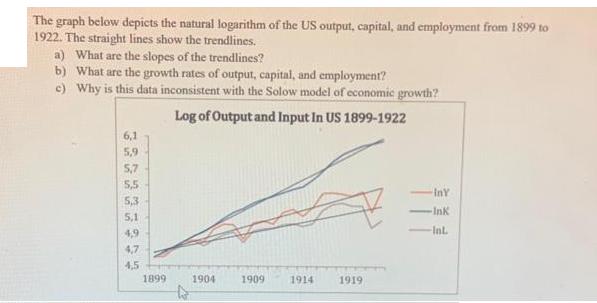
The graph below depicts the natural logarithm of the US output, capital, and employment from 1899 to 1922. The straight lines show the trendlines.

The graph below depicts the natural logarithm of the US output, capital, and employment from 1899 to 1922. The straight lines show the trendlines. a) What are the slopes of the trendlines? b) What are the growth rates of output, capital, and employment? c) Why is this data inconsistent with the Solow model of economic growth? Log of Output and Input In US 1899-1922 6,1 5,9 5,7 5,5 5,3 5,1 4,9 4,7 4,5 1899 1904 1909 1914 1919 inY -Ink -Int
Step by Step Solution
3.32 Rating (143 Votes )
There are 3 Steps involved in it
Step: 1
a The slopes of the trendlines for the natural logarithm of output capital and employment are approximately 004 005 and 003 respectively Explanation The trendline for each variable output capital and ...
Get Instant Access to Expert-Tailored Solutions
See step-by-step solutions with expert insights and AI powered tools for academic success
Step: 2

Step: 3

Ace Your Homework with AI
Get the answers you need in no time with our AI-driven, step-by-step assistance
Get StartedRecommended Textbook for
Income Tax Fundamentals 2013
Authors: Gerald E. Whittenburg, Martha Altus Buller, Steven L Gill
31st Edition
1111972516, 978-1285586618, 1285586611, 978-1285613109, 978-1111972516
Students also viewed these Economics questions
Question
Answered: 1 week ago
Question
Answered: 1 week ago
Question
Answered: 1 week ago
Question
Answered: 1 week ago
Question
Answered: 1 week ago
Question
Answered: 1 week ago
Question
Answered: 1 week ago
Question
Answered: 1 week ago
Question
Answered: 1 week ago
Question
Answered: 1 week ago
Question
Answered: 1 week ago
Question
Answered: 1 week ago
Question
Answered: 1 week ago
Question
Answered: 1 week ago
Question
Answered: 1 week ago
Question
Answered: 1 week ago
Question
Answered: 1 week ago
Question
Answered: 1 week ago
Question
Answered: 1 week ago
Question
Answered: 1 week ago
Question
Answered: 1 week ago
Question
Answered: 1 week ago
View Answer in SolutionInn App


