

Answered step by step
Verified Expert Solution
Question
1 Approved Answer
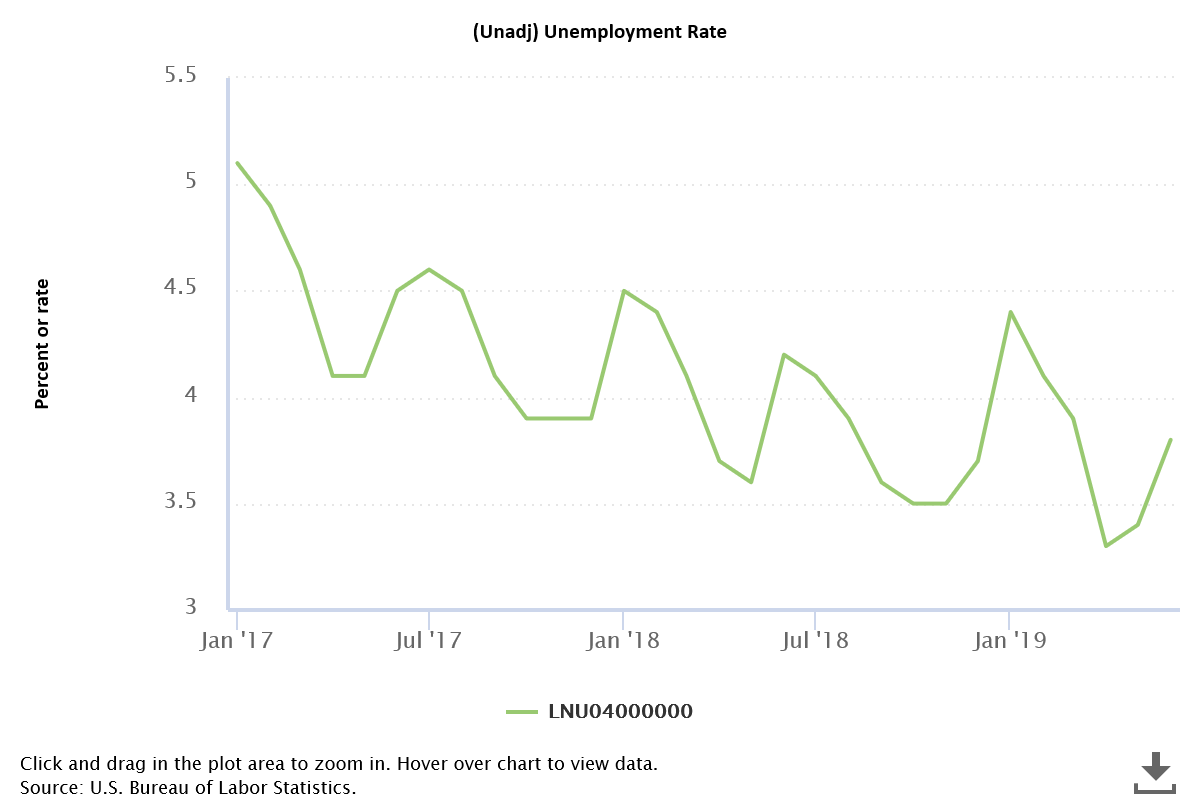
The graph below illustrates the US unemployment rate from January 2016 to June 2019. Which forecasting model(s) appear to be the most suitable (no calculations
The graph below illustrates the US unemployment rate from January 2016 to June 2019. Which forecasting model(s) appear to be the most suitable (no calculations required).
Step by Step Solution
There are 3 Steps involved in it
Step: 1

Get Instant Access to Expert-Tailored Solutions
See step-by-step solutions with expert insights and AI powered tools for academic success
Step: 2

Step: 3
Ace Your Homework with AI
Get the answers you need in no time with our AI-driven, step-by-step assistance
Get Started
An Introduction to the Mathematics of Financial Derivatives
Authors: Ali Hirsa, Salih N. Neftci
3rd edition
012384682X, 978-0123846822