Question
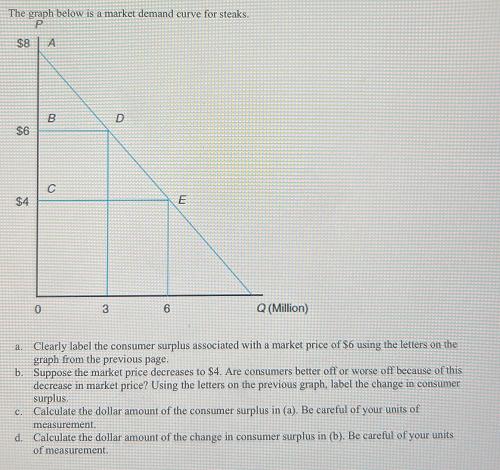
The graph below is a market demand curve for steaks. $8 A $6 B D C $4 E 0 3 6 Q (Million) a.

The graph below is a market demand curve for steaks. $8 A $6 B D C $4 E 0 3 6 Q (Million) a. Clearly label the consumer surplus associated with a market price of $6 using the letters on the graph from the previous page. b. Suppose the market price decreases to $4. Are consumers better off or worse off because of this decrease in market price? Using the letters on the previous graph, label the change in consumer surplus. c. Calculate the dollar amount of the consumer surplus in (a). Be careful of your units of measurement. d. Calculate the dollar amount of the change in consumer surplus in (b). Be careful of your units of measurement.
Step by Step Solution
There are 3 Steps involved in it
Step: 1

Get Instant Access to Expert-Tailored Solutions
See step-by-step solutions with expert insights and AI powered tools for academic success
Step: 2

Step: 3

Ace Your Homework with AI
Get the answers you need in no time with our AI-driven, step-by-step assistance
Get StartedRecommended Textbook for
Economics
Authors: R. Glenn Hubbard
6th edition
978-0134797731, 134797736, 978-0134106243
Students also viewed these Economics questions
Question
Answered: 1 week ago
Question
Answered: 1 week ago
Question
Answered: 1 week ago
Question
Answered: 1 week ago
Question
Answered: 1 week ago
Question
Answered: 1 week ago
Question
Answered: 1 week ago
Question
Answered: 1 week ago
Question
Answered: 1 week ago
Question
Answered: 1 week ago
Question
Answered: 1 week ago
Question
Answered: 1 week ago
Question
Answered: 1 week ago
Question
Answered: 1 week ago
Question
Answered: 1 week ago
Question
Answered: 1 week ago
Question
Answered: 1 week ago
Question
Answered: 1 week ago
Question
Answered: 1 week ago
Question
Answered: 1 week ago
Question
Answered: 1 week ago
Question
Answered: 1 week ago
Question
Answered: 1 week ago
View Answer in SolutionInn App


