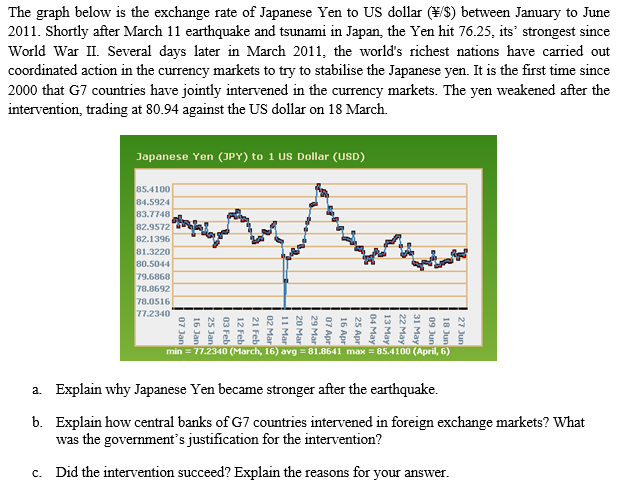
The graph below is the exchange rate of Japanese Yen to US dollar ($) between January to June 2011. Shortly after March 11 earthquake and tsunami in Japan, the Yen hit 76.25, its' strongest since World War II. Several days later in March 2011, the world's richest nations have carried out coordinated action in the currency markets to try to stabilise the Japanese yen. It is the first time since 2000 that G7 countries have jointly intervened in the currency markets. The yen weakened after the intervention, trading at 80.94 against the US dollar on 18 March. Japanese Yen (JPY) to 1 US Dollar (USD) 85.4100 84.5924 83.7748 82.9572 82.1396 81.3220 80.50-44 79.6868 78.8692 78.0516 77.2340 03 Feb 12 Feb 21 Feb 02 Ma 11 Mar 20 Mar 29 Mar 07 Apr 16 Apr 25 Apr kew 10 13 May 22 May 31 May 09 Jur 18 Jun 27 Jun min = 77.2340 (March, 16) avg = 81.8641 max = 85.4100 (April, 6) a. Explain why Japanese Yen became stronger after the earthquake. b. Explain how central banks of G7 countries intervened in foreign exchange markets? What was the government's justification for the intervention? c. Did the intervention succeed? Explain the reasons for your answer. The graph below is the exchange rate of Japanese Yen to US dollar ($) between January to June 2011. Shortly after March 11 earthquake and tsunami in Japan, the Yen hit 76.25, its' strongest since World War II. Several days later in March 2011, the world's richest nations have carried out coordinated action in the currency markets to try to stabilise the Japanese yen. It is the first time since 2000 that G7 countries have jointly intervened in the currency markets. The yen weakened after the intervention, trading at 80.94 against the US dollar on 18 March. Japanese Yen (JPY) to 1 US Dollar (USD) 85.4100 84.5924 83.7748 82.9572 82.1396 81.3220 80.50-44 79.6868 78.8692 78.0516 77.2340 03 Feb 12 Feb 21 Feb 02 Ma 11 Mar 20 Mar 29 Mar 07 Apr 16 Apr 25 Apr kew 10 13 May 22 May 31 May 09 Jur 18 Jun 27 Jun min = 77.2340 (March, 16) avg = 81.8641 max = 85.4100 (April, 6) a. Explain why Japanese Yen became stronger after the earthquake. b. Explain how central banks of G7 countries intervened in foreign exchange markets? What was the government's justification for the intervention? c. Did the intervention succeed? Explain the reasons for your


