Answered step by step
Verified Expert Solution
Question
1 Approved Answer
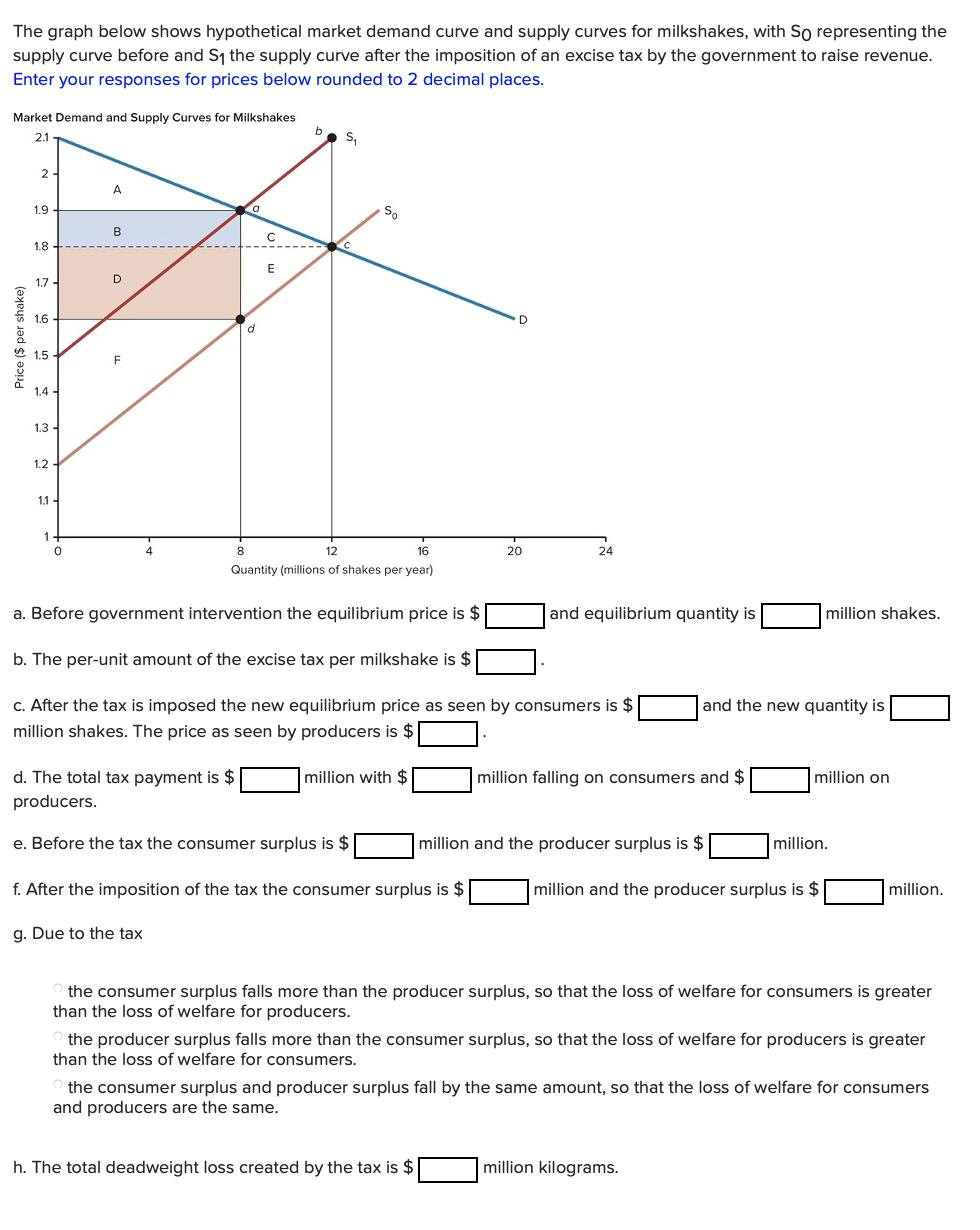
The graph below shows hypothetical market demand curve and supply curves for milkshakes, with So representing the supply curve before and S1 the supply

The graph below shows hypothetical market demand curve and supply curves for milkshakes, with So representing the supply curve before and S1 the supply curve after the imposition of an excise tax by the government to raise revenue. Enter your responses for prices below rounded to 2 decimal places. Market Demand and Supply Curves for Milkshakes 2.1 S, 2 A 1.9 So B 1.8 1.7 - D 1.6 2 1.5 F 1.4 - 1.3 1.2 1.1 - 1- 12 16 20 24 Quantity (millions of shakes per year) a. Before government intervention the equilibrium price is $ and equilibrium quantity is million shakes. b. The per-unit amount of the excise tax per milkshake is $ C. After the tax is imposed the new equilibrium price as seen by consumers is $ million shakes. The price as seen by producers is $ and the new quantity is d. The total tax payment is $ million with $ million falling on consumers and $ million on producers. e. Before the tax the consumer surplus is $ million and the producer surplus is $ million. f. After the imposition of the tax the consumer surplus is $ million and the producer surplus is $ million. g. Due to the tax the consumer surplus falls more than the producer surplus, so that the loss of welfare for consumers is greater than the loss of welfare for producers. the producer surplus falls more than the consumer surplus, so that the loss of welfare for producers is greater than the loss of welfare for consumers. the consumer surplus and producer surplus fall by the same amount, so that the loss of welfare for consumers and producers are the same. h. The total deadweight loss created by the tax is $ million kilograms. Price ($ per shake)
Step by Step Solution
★★★★★
3.52 Rating (152 Votes )
There are 3 Steps involved in it
Step: 1
a The equilibrium price is 18 per shake and quantity is 12 million shakes S0D b Per unit amount of E...
Get Instant Access to Expert-Tailored Solutions
See step-by-step solutions with expert insights and AI powered tools for academic success
Step: 2

Step: 3

Ace Your Homework with AI
Get the answers you need in no time with our AI-driven, step-by-step assistance
Get Started


