Answered step by step
Verified Expert Solution
Question
1 Approved Answer
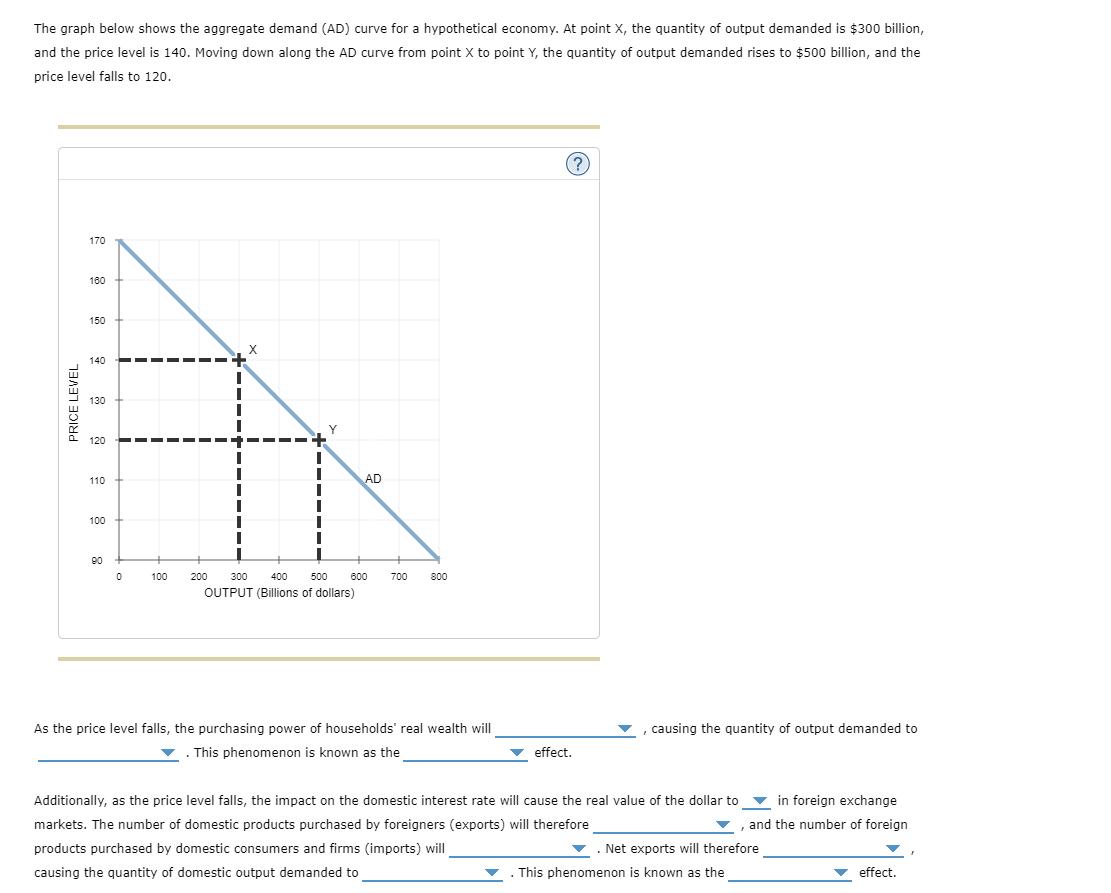
The graph below shows the aggregate demand (AD) curve for a hypothetical economy. At point X, the quantity of output demanded is $300 billion,

The graph below shows the aggregate demand (AD) curve for a hypothetical economy. At point X, the quantity of output demanded is $300 billion, and the price level is 140. Moving down along the AD curve from point X to point Y, the quantity of output demanded rises to $500 billion, and the price level falls to 120. PRICE LEVEL 170 160 150 140 130 120 110 100 90 0 100 X 1 Y AD 500 200 300 400 OUTPUT (Billions of dollars) 600 700 800 As the price level falls, the purchasing power of households' real wealth will . This phenomenon is known as the effect. ? 1 causing the quantity of output demanded to Additionally, as the price level falls, the impact on the domestic interest rate will cause the real value of the dollar to in foreign exchange markets. The number of domestic products purchased by foreigners (exports) will therefore and the number of foreign products purchased by domestic consumers and firms (imports) will causing the quantity of domestic output demanded to . Net exports will therefore This phenomenon is known as the effect.
Step by Step Solution
★★★★★
3.44 Rating (151 Votes )
There are 3 Steps involved in it
Step: 1
The image depicts a graph of the Aggregate Demand AD curve for a hypothetical economy In the text th...
Get Instant Access to Expert-Tailored Solutions
See step-by-step solutions with expert insights and AI powered tools for academic success
Step: 2

Step: 3

Ace Your Homework with AI
Get the answers you need in no time with our AI-driven, step-by-step assistance
Get Started


