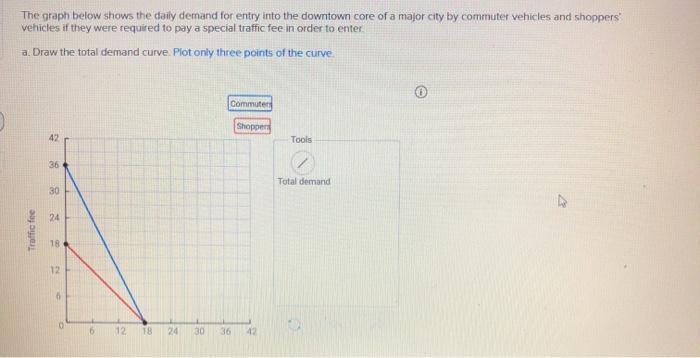
Question: The graph below shows the daily demand for entry into the downtown core of a major city by commuter vehicles and shoppers' vehicles if


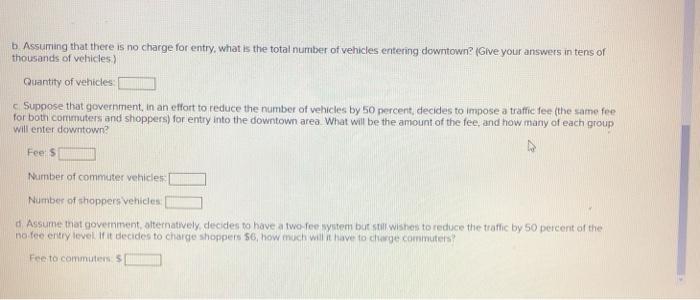
The graph below shows the daily demand for entry into the downtown core of a major city by commuter vehicles and shoppers' vehicles if they were required to pay a special traffic fee in order to enter. a. Draw the total demand curve. Plot only three points of the curve. Commuters Shoppers 42 Tools 36 Total demand 30 24 18 12 6 12 18 24 30 36 42 Traffic fee b Assuming that there is no charge for entry, what is the total number of vehicles entering downtown? (Give your answers in tens of thousands of vehicles) Quantity of vehicles: c. Suppose that government, in an effort to reduce the number of vehicles by 50 percent, decides to impose a traffic fee (the same fee for both commuters and shoppers) for entry into the downtown area What will be the amount of the fee, and how many of each group will enter downtown? Fee: S Number of commuter vehicles: Number of shoppers vehicles d. Assume that government, aolternatively, decides to have a two-fee system but still wishes to reduce the traffic by 50 percent of the no fee entry level If it decides to charge shoppers $6, how much will it have to charge commuters? Fee to commuters: $
Step by Step Solution
3.38 Rating (164 Votes )
There are 3 Steps involved in it

Get step-by-step solutions from verified subject matter experts


