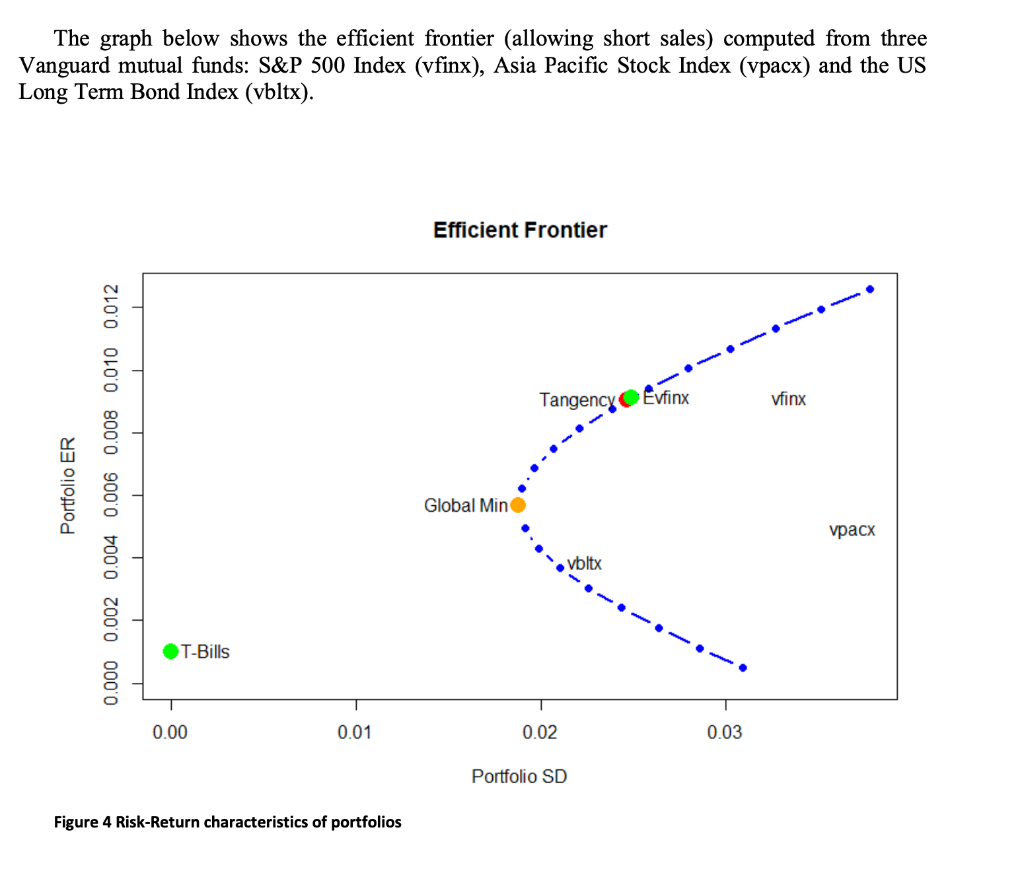
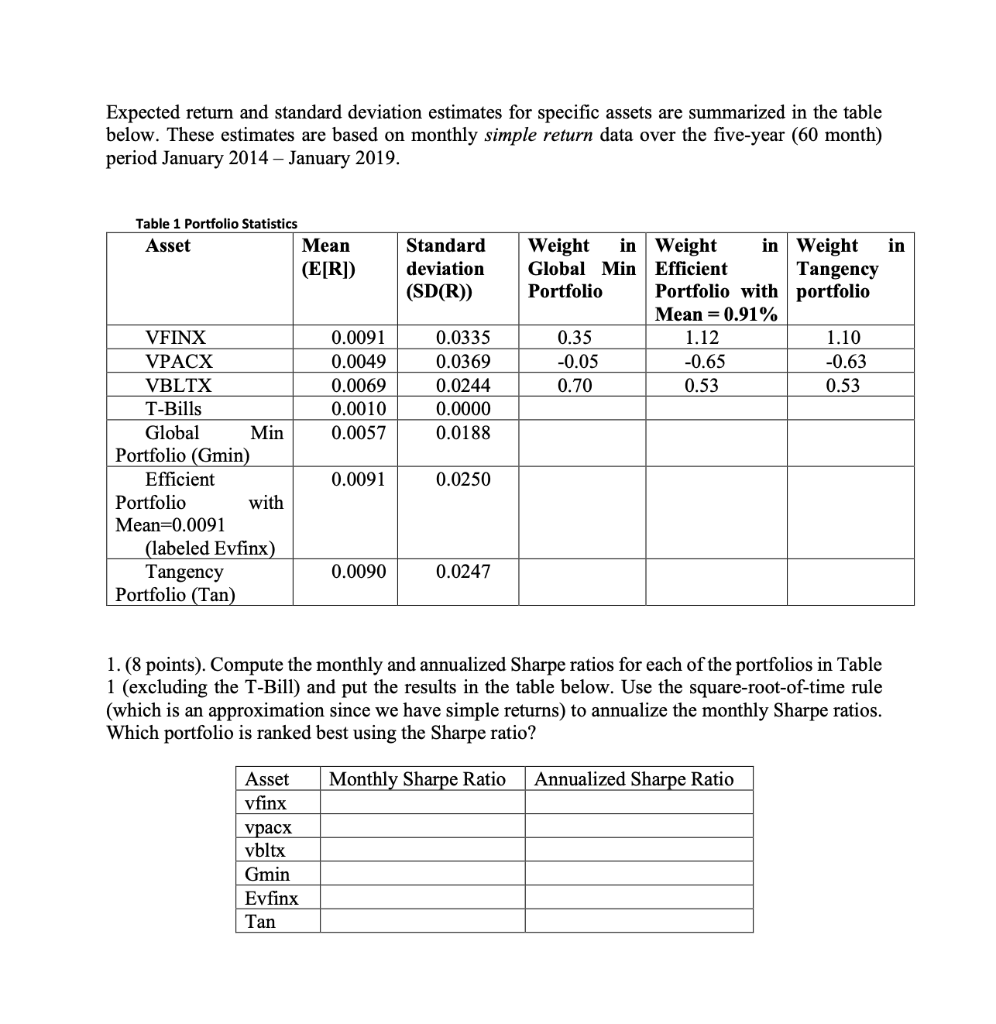
The graph below shows the efficient frontier (allowing short sales) computed from three Vanguard mutual funds: S&P 500 Index (vfinx), Asia Pacific Stock Index (vpacx) and the US Long Term Bond Index (vbltx). Efficient Frontier Tangency Evfinx vfinx Portfolio ER 0.000 0.002 0.004 0.006 0.008 0.010 0.012 Global Min vpacx . vbltx T-Bills 0.00 0.01 0.02 0.03 Portfolio SD Figure 4 Risk-Return characteristics of portfolios Expected return and standard deviation estimates for specific assets are summarized in the table below. These estimates are based on monthly simple return data over the five-year (60 month) period January 2014 - January 2019. Table 1 Portfolio Statistics Asset Mean (E[R]) Standard deviation (SD(R) Weight in Weight in Weight in Global Min Efficient Tangency Portfolio Portfolio with portfolio Mean = 0.91% 0.35 1.12 1.10 -0.05 -0.65 -0.63 0.70 0.53 0.53 0.0091 0.0049 0.0069 0.0010 0.0057 0.0335 0.0369 0.0244 0.0000 0.0188 VFINX VPACX VBLTX T-Bills Global Min Portfolio (Gmin) Efficient Portfolio with Mean=0.0091 (labeled Evfinx) Tangency Portfolio (Tan) 0.0091 0.0250 0.0090 0.0247 1. (8 points). Compute the monthly and annualized Sharpe ratios for each of the portfolios in Table 1 (excluding the T-Bill) and put the results in the table below. Use the square-root-of-time rule (which is an approximation since we have simple returns) to annualize the monthly Sharpe ratios. Which portfolio is ranked best using the Sharpe ratio? Monthly Sharpe Ratio Annualized Sharpe Ratio Asset vfinx vpacx vbltx Gmin Evfinx Tan 2. The Sharpe ratios you computed in part 1 above are estimates. Write down the 95 % two-sided confidence interval for these estimated Sharpe ratios by using bootstraps. Briefly explain your results. 3. Find the efficient portfolio of risky assets only (i.e., a portfolio on the Markowitz bullet) that has an expected monthly return equal to 0.01 (1%). In this portfolio, how much is invested in vfinx, vpacx, and vbltx? Show this portfolio on Figure 4. 4. How much should be invested in T-bills and the tangency portfolio to create an efficient portfolio with target standard deviation equal to 0.01 (1%)? What is the expected return of this efficient portfolio? Indicate the location of this efficient portfolio on Figure 4. The graph below shows the efficient frontier (allowing short sales) computed from three Vanguard mutual funds: S&P 500 Index (vfinx), Asia Pacific Stock Index (vpacx) and the US Long Term Bond Index (vbltx). Efficient Frontier Tangency Evfinx vfinx Portfolio ER 0.000 0.002 0.004 0.006 0.008 0.010 0.012 Global Min vpacx . vbltx T-Bills 0.00 0.01 0.02 0.03 Portfolio SD Figure 4 Risk-Return characteristics of portfolios Expected return and standard deviation estimates for specific assets are summarized in the table below. These estimates are based on monthly simple return data over the five-year (60 month) period January 2014 - January 2019. Table 1 Portfolio Statistics Asset Mean (E[R]) Standard deviation (SD(R) Weight in Weight in Weight in Global Min Efficient Tangency Portfolio Portfolio with portfolio Mean = 0.91% 0.35 1.12 1.10 -0.05 -0.65 -0.63 0.70 0.53 0.53 0.0091 0.0049 0.0069 0.0010 0.0057 0.0335 0.0369 0.0244 0.0000 0.0188 VFINX VPACX VBLTX T-Bills Global Min Portfolio (Gmin) Efficient Portfolio with Mean=0.0091 (labeled Evfinx) Tangency Portfolio (Tan) 0.0091 0.0250 0.0090 0.0247 1. (8 points). Compute the monthly and annualized Sharpe ratios for each of the portfolios in Table 1 (excluding the T-Bill) and put the results in the table below. Use the square-root-of-time rule (which is an approximation since we have simple returns) to annualize the monthly Sharpe ratios. Which portfolio is ranked best using the Sharpe ratio? Monthly Sharpe Ratio Annualized Sharpe Ratio Asset vfinx vpacx vbltx Gmin Evfinx Tan 2. The Sharpe ratios you computed in part 1 above are estimates. Write down the 95 % two-sided confidence interval for these estimated Sharpe ratios by using bootstraps. Briefly explain your results. 3. Find the efficient portfolio of risky assets only (i.e., a portfolio on the Markowitz bullet) that has an expected monthly return equal to 0.01 (1%). In this portfolio, how much is invested in vfinx, vpacx, and vbltx? Show this portfolio on Figure 4. 4. How much should be invested in T-bills and the tangency portfolio to create an efficient portfolio with target standard deviation equal to 0.01 (1%)? What is the expected return of this efficient portfolio? Indicate the location of this efficient portfolio on Figure 4