Question
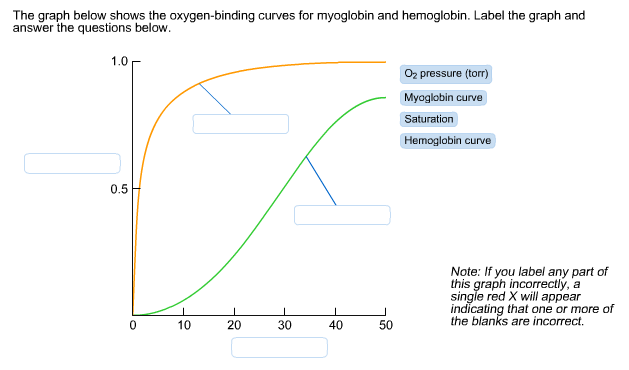
The graph below shows the oxygen-binding curves from myoglobinand hemoglobin The graph below shows the oxygen-binding curves for myoglobin and hemoglobin. Label the graph and
The graph below shows the oxygen-binding curves from myoglobinand hemoglobin

The graph below shows the oxygen-binding curves for myoglobin and hemoglobin. Label the graph and answer the questions below. 1.0 0.5 0 10 20 I 30 I 40 50 O pressure (torr) Myoglobin curve Saturation Hemoglobin curve Note: If you label any part of this graph incorrectly, a single red X will appear indicating that one or more of the blanks are incorrect.
Step by Step Solution
3.37 Rating (153 Votes )
There are 3 Steps involved in it
Step: 1
Step 1 The affinity for the binding of oxygen is different ...
Get Instant Access to Expert-Tailored Solutions
See step-by-step solutions with expert insights and AI powered tools for academic success
Step: 2

Step: 3

Ace Your Homework with AI
Get the answers you need in no time with our AI-driven, step-by-step assistance
Get StartedRecommended Textbook for
Financial Algebra advanced algebra with financial applications
Authors: Robert K. Gerver
1st edition
978-1285444857, 128544485X, 978-0357229101, 035722910X, 978-0538449670
Students also viewed these Chemistry questions
Question
Answered: 1 week ago
Question
Answered: 1 week ago
Question
Answered: 1 week ago
Question
Answered: 1 week ago
Question
Answered: 1 week ago
Question
Answered: 1 week ago
Question
Answered: 1 week ago
Question
Answered: 1 week ago
Question
Answered: 1 week ago
Question
Answered: 1 week ago
Question
Answered: 1 week ago
Question
Answered: 1 week ago
Question
Answered: 1 week ago
Question
Answered: 1 week ago
Question
Answered: 1 week ago
Question
Answered: 1 week ago
Question
Answered: 1 week ago
Question
Answered: 1 week ago
Question
Answered: 1 week ago
Question
Answered: 1 week ago
Question
Answered: 1 week ago
Question
Answered: 1 week ago
View Answer in SolutionInn App


