

Question
The graph below shows the returns and standard deviations of the portfolios of assets A and B. Asset A has an expected return of 5%
The graph below shows the returns and standard deviations of the portfolios of assets A and B. Asset A has an expected return of 5% and standard deviation of 20%. Asset B has an expected return of 12% and standard deviation of 50%. The returns on the two assets are perfectly positively correlated. Portfolio X has an expected return of 6.75% and standard deviation of 27.5%. What is the portfolio weight on asset B in the portfolio marked X on the graph?
Round your answer to two decimal places and show full steps.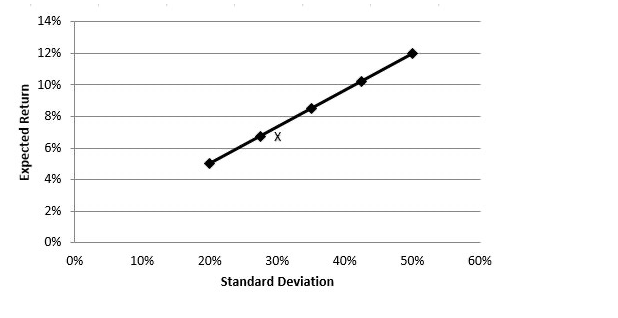
Step by Step Solution
There are 3 Steps involved in it
Step: 1

Get Instant Access to Expert-Tailored Solutions
See step-by-step solutions with expert insights and AI powered tools for academic success
Step: 2

Step: 3
Ace Your Homework with AI
Get the answers you need in no time with our AI-driven, step-by-step assistance
Get Started
Financial Accounting Essentials You Always Wanted To Know Self Learning Management Series
Authors: Vibrant Publishers , Kalpesh Ashar
5th Edition
1636510973, 978-1636510972