

Answered step by step
Verified Expert Solution
Question
1 Approved Answer
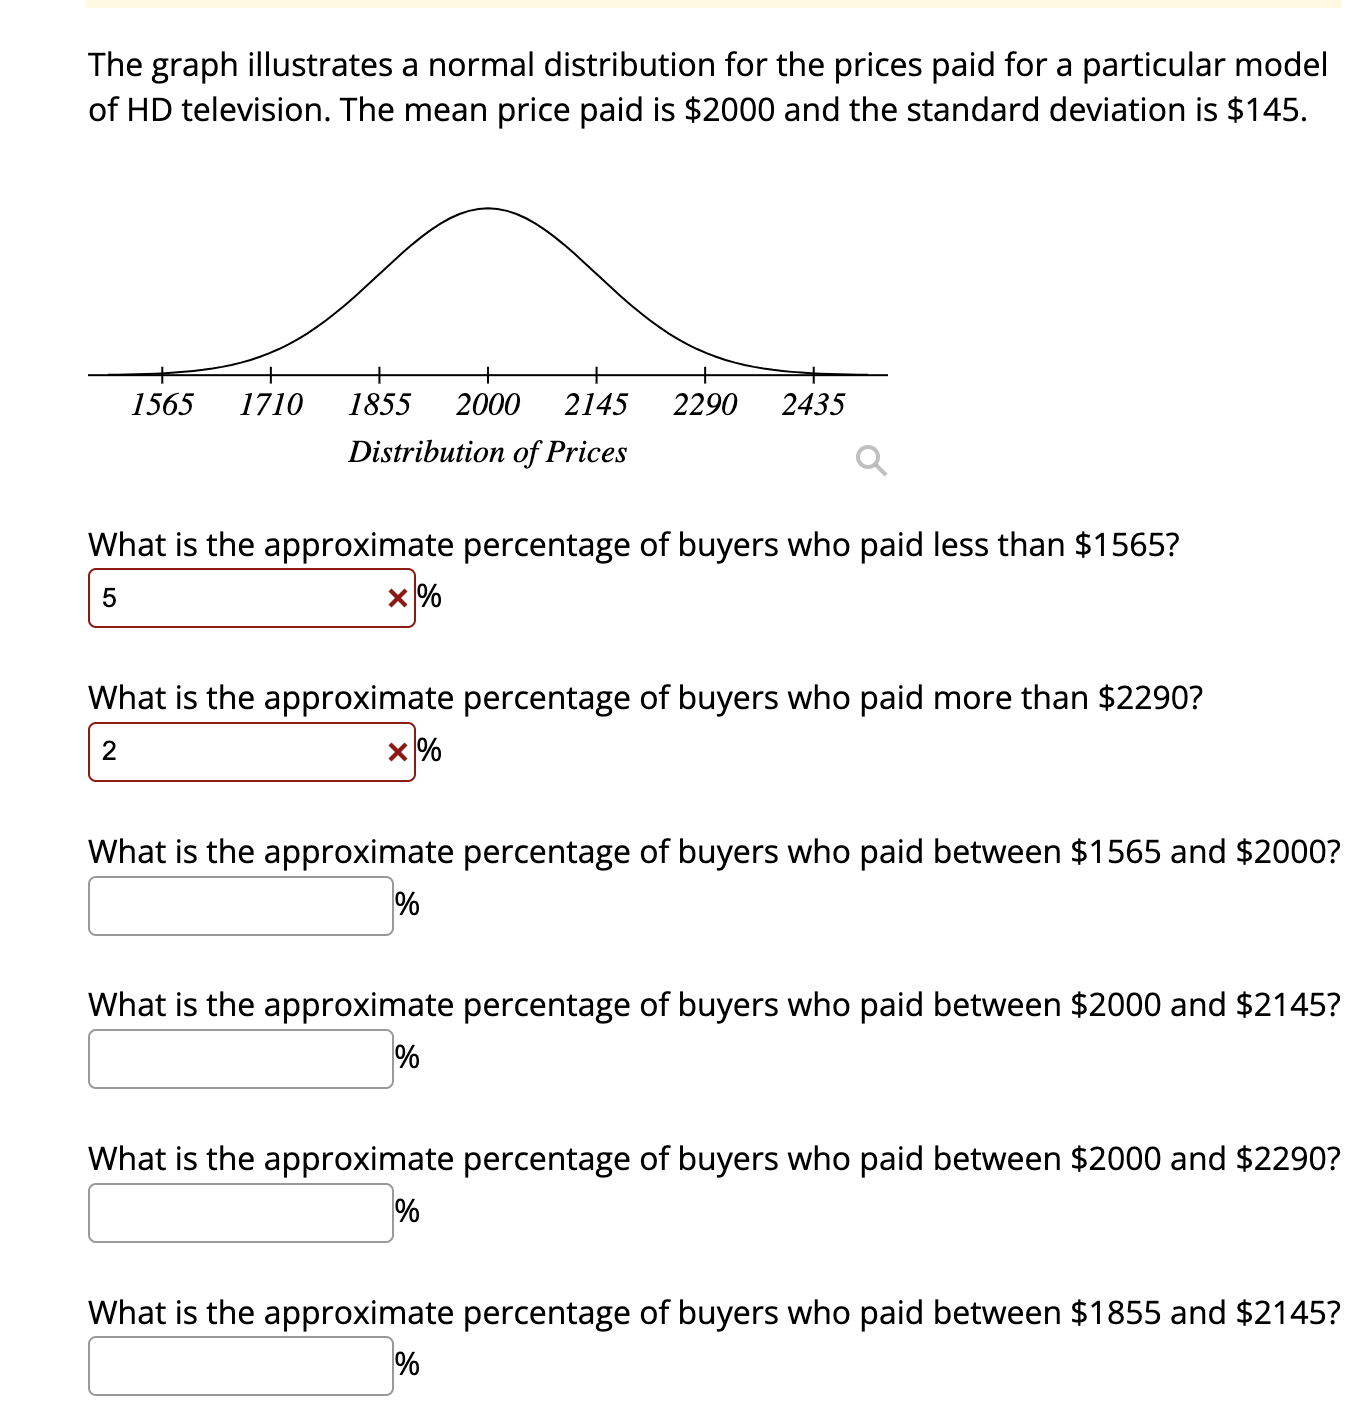
The graph illustrates a normal distribution for the prices paid for a particular model of HD television. The mean price paid is $ 2 0
The graph illustrates a normal distribution for the prices paid for a particular model
of HD television. The mean price paid is $ and the standard deviation is $
What is the approximate percentage of buyers who paid less than $
What is the approximate percentage of buyers who paid more than $
What is the approximate percentage of buyers who paid between $ and $
What is the approximate percentage of buyers who paid between $ and $
What is the approximate percentage of buyers who paid between $ and $
What is the approximate percentage of buyers who paid between $ and $
Step by Step Solution
There are 3 Steps involved in it
Step: 1

Get Instant Access to Expert-Tailored Solutions
See step-by-step solutions with expert insights and AI powered tools for academic success
Step: 2

Step: 3
Ace Your Homework with AI
Get the answers you need in no time with our AI-driven, step-by-step assistance
Get Started
Transportation A Global Supply Chain Perspective
Authors: John J. Coyle, Robert A. Novak, Brian Gibson, Edward J. Bard
8th edition
9781305445352, 1133592961, 130544535X, 978-1133592969