

Answered step by step
Verified Expert Solution
Question
1 Approved Answer
The graph illustrates a normal distribution for the prices paid for a particular model of HD television. The mean price paid is $1000 and
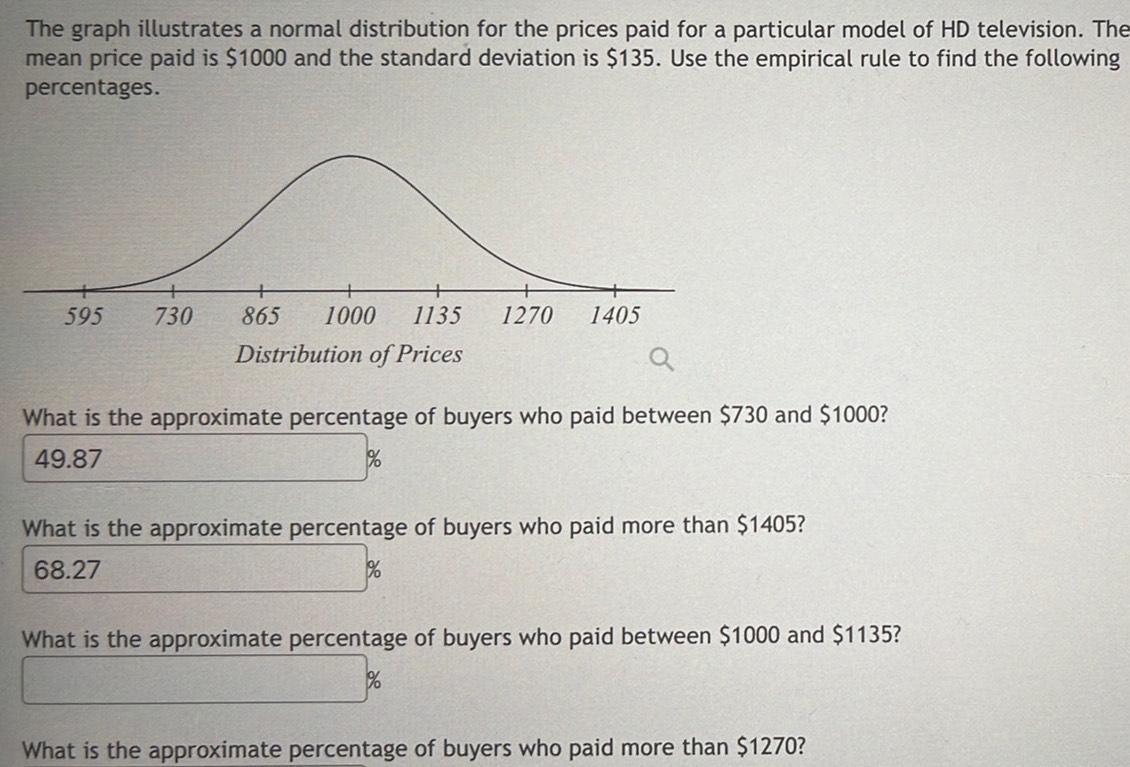
The graph illustrates a normal distribution for the prices paid for a particular model of HD television. The mean price paid is $1000 and the standard deviation is $135. Use the empirical rule to find the following percentages. 595 730 865 1000 1135 1270 1405 Distribution of Prices a What is the approximate percentage of buyers who paid between $730 and $1000? 49.87 % What is the approximate percentage of buyers who paid more than $1405? 68.27 % What is the approximate percentage of buyers who paid between $1000 and $1135? % What is the approximate percentage of buyers who paid more than $1270?
Step by Step Solution
There are 3 Steps involved in it
Step: 1

Get Instant Access to Expert-Tailored Solutions
See step-by-step solutions with expert insights and AI powered tools for academic success
Step: 2

Step: 3
Ace Your Homework with AI
Get the answers you need in no time with our AI-driven, step-by-step assistance
Get Started
Quantitative Methods For Business Management And Finance
Authors: Louise Swift, Sally Piff
2nd Edition
1403935289, 9781403935281