Answered step by step
Verified Expert Solution
Question
1 Approved Answer
The graph of f(x) = 8 x* and the line | which is tangent to f at x = 1 is shown in the figure
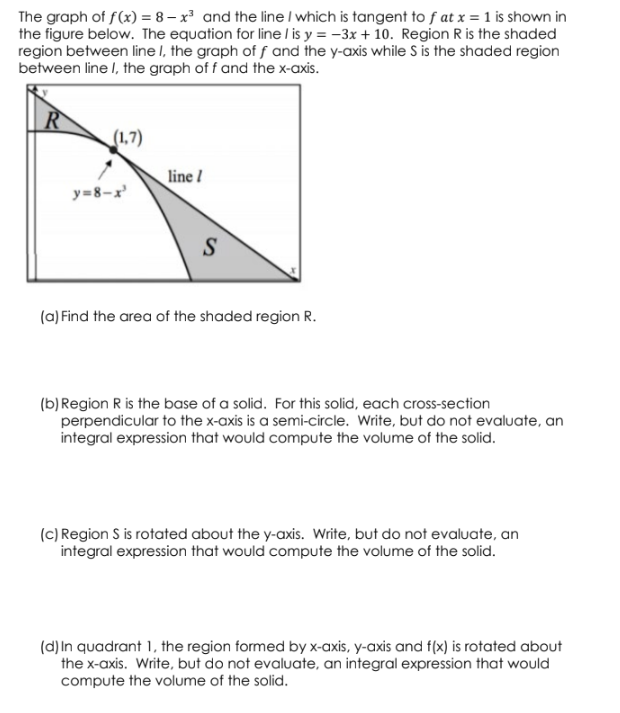
The graph of f(x) = 8 x* and the line | which is tangent to f at x = 1 is shown in the figure below. The equation for line | is y = 3x + 10. Region R is the shaded region between line |, the graph of f and the y-axis while is the shaded region between line I, the graph of f and the x-axis. (a) Find the area of the shaded region R. (b)Region R is the base of a solid. For this solid, each cross-section perpendicular to the x-axis is a semi-circle. Write, but do not evaluate, an integral expression that would compute the volume of the solid. (c) Region is rotated about the y-axis. Write, but do not evaluate, an integral expression that would compute the volume of the solid. (d)In quadrant 1, the region formed by x-axis, y-axis and f(x) is rotated about the x-axis. Write, but do not evaluate, an integral expression that would compute the volume of the solid
Step by Step Solution
There are 3 Steps involved in it
Step: 1
Get Instant Access to Expert-Tailored Solutions
See step-by-step solutions with expert insights and AI powered tools for academic success
Step: 2
Step: 3
Ace Your Homework with AI
Get the answers you need in no time with our AI-driven, step-by-step assistance
Get Started