

Answered step by step
Verified Expert Solution
Question
1 Approved Answer
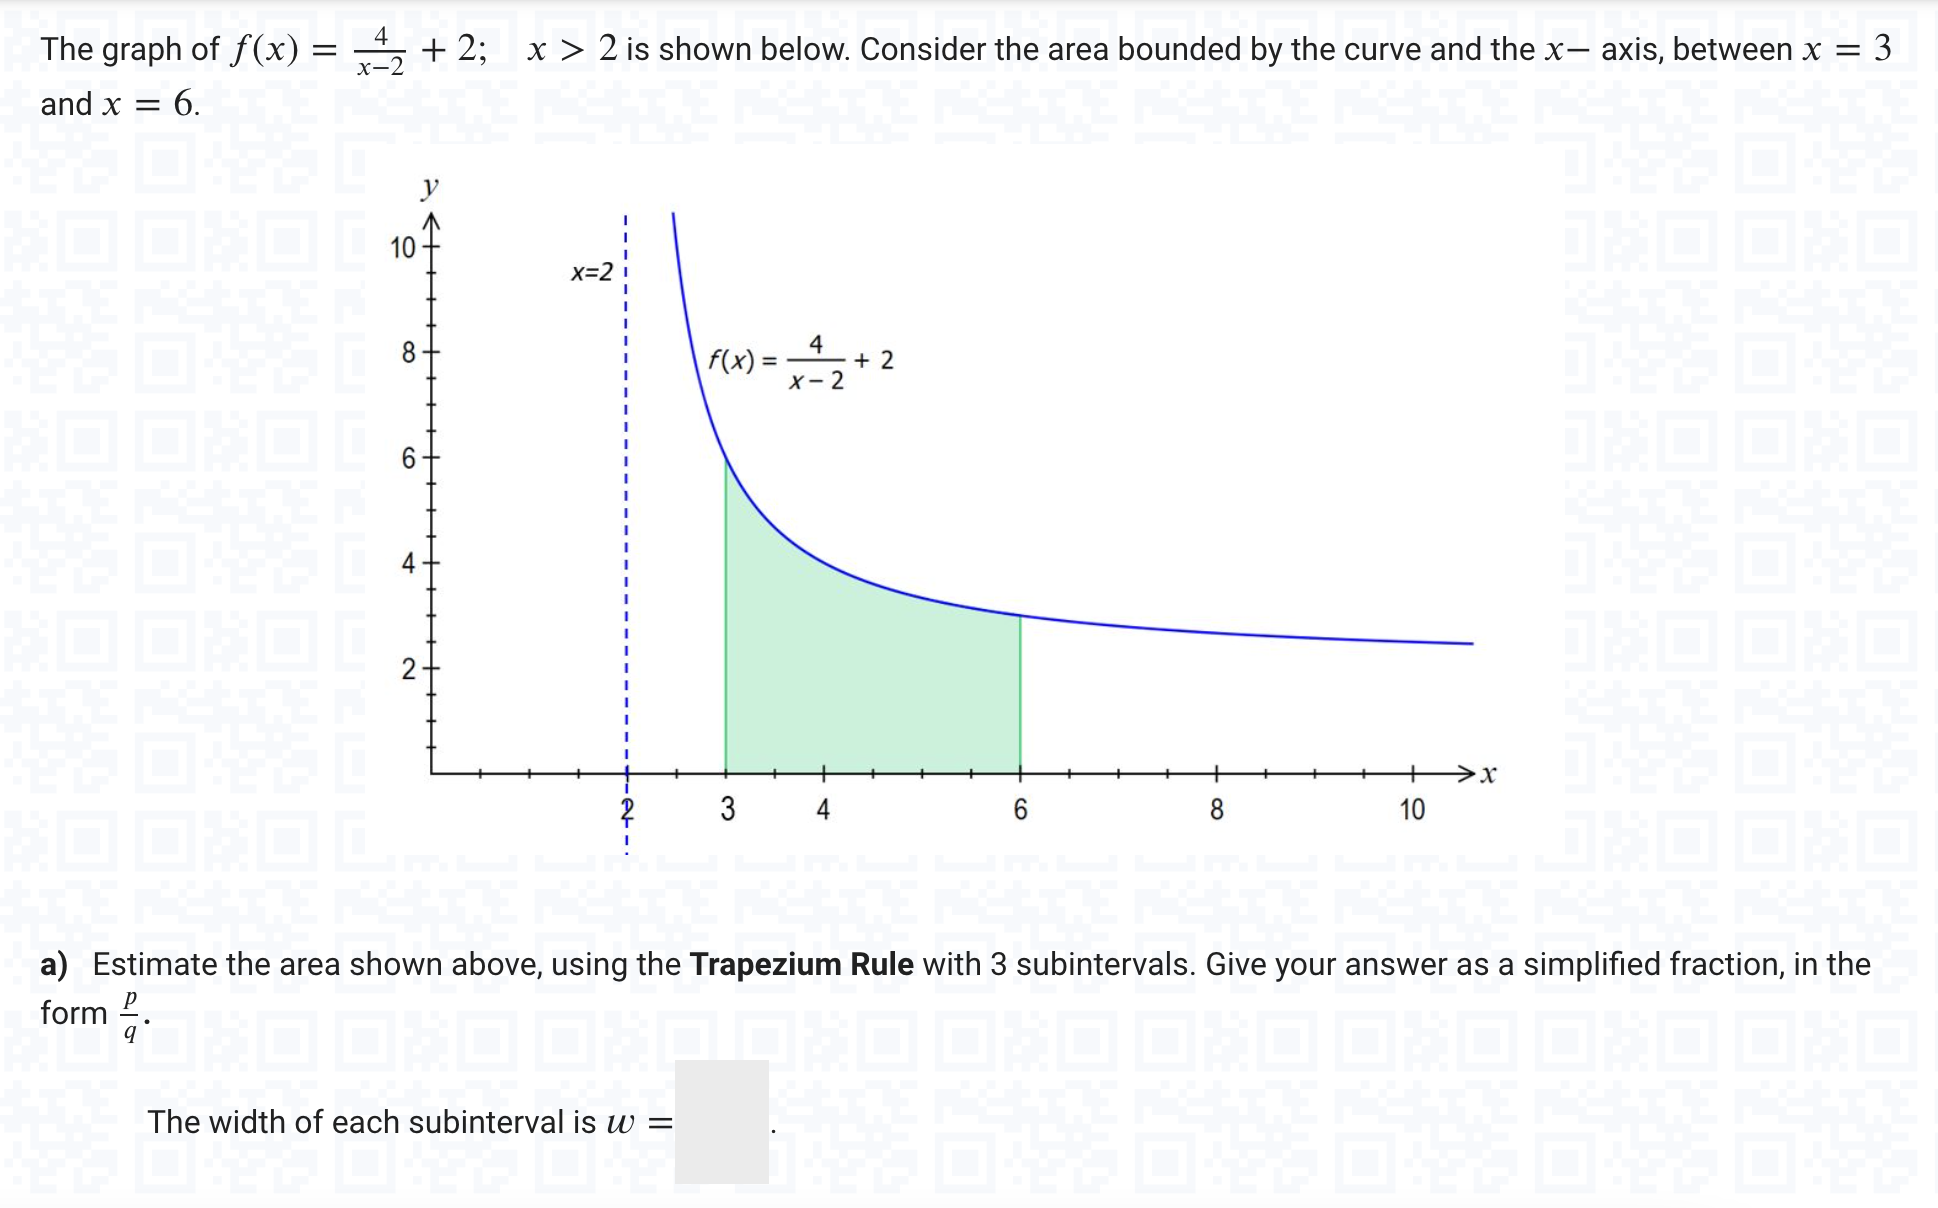
The graph of f(x) = x412 + 2; x > 2 is shown below. Consider the area bounded by the curve and the x axis,


Step by Step Solution
There are 3 Steps involved in it
Step: 1

Get Instant Access to Expert-Tailored Solutions
See step-by-step solutions with expert insights and AI powered tools for academic success
Step: 2

Step: 3
Ace Your Homework with AI
Get the answers you need in no time with our AI-driven, step-by-step assistance
Get Started
Basic College Mathematics W/Early Integers (Subscription)
Authors: Elayn Martin Gay
3rd Edition
0134186419, 9780134186412