Question
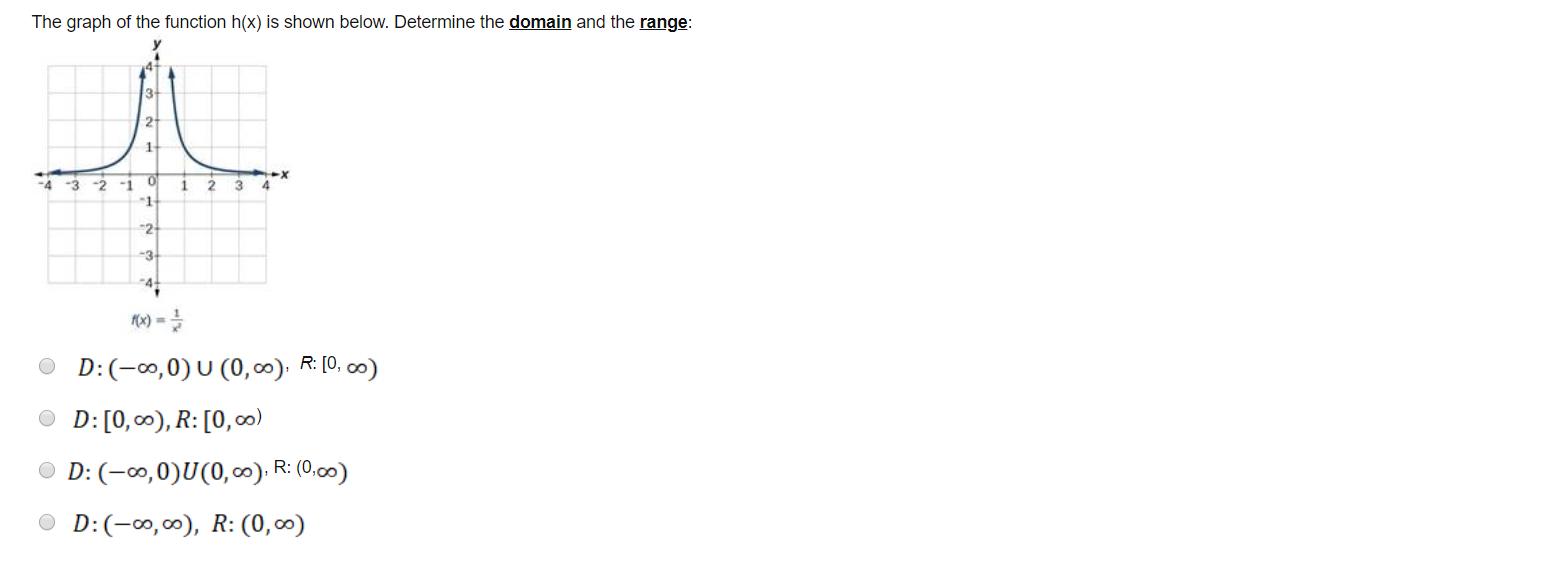
The graph of the function h(x) is shown below. Determine the domain and the range: 1. -4 -3 -2 -1 3. -1 2 -3

The graph of the function h(x) is shown below. Determine the domain and the range: 1. -4 -3 -2 -1 3. -1 "2 -3 D:(-00,0) U (0, o), R: [0, ) D: [0, 00), R: [0,0) D: (-0,0)U(0,00): R: (0,00) D:(-0,00), R: (0,00)
Step by Step Solution
3.50 Rating (153 Votes )
There are 3 Steps involved in it
Step: 1
Here the answer is We see from the graph that the function is goin...
Get Instant Access to Expert-Tailored Solutions
See step-by-step solutions with expert insights and AI powered tools for academic success
Step: 2

Step: 3

Ace Your Homework with AI
Get the answers you need in no time with our AI-driven, step-by-step assistance
Get StartedRecommended Textbook for
Matlab An Introduction with Applications
Authors: Amos Gilat
5th edition
1118629868, 978-1118801802, 1118801806, 978-1118629864
Students also viewed these Mathematics questions
Question
Answered: 1 week ago
Question
Answered: 1 week ago
Question
Answered: 1 week ago
Question
Answered: 1 week ago
Question
Answered: 1 week ago
Question
Answered: 1 week ago
Question
Answered: 1 week ago
Question
Answered: 1 week ago
Question
Answered: 1 week ago
Question
Answered: 1 week ago
Question
Answered: 1 week ago
Question
Answered: 1 week ago
Question
Answered: 1 week ago
Question
Answered: 1 week ago
Question
Answered: 1 week ago
Question
Answered: 1 week ago
Question
Answered: 1 week ago
Question
Answered: 1 week ago
Question
Answered: 1 week ago
Question
Answered: 1 week ago
Question
Answered: 1 week ago
Question
Answered: 1 week ago
View Answer in SolutionInn App


