Question
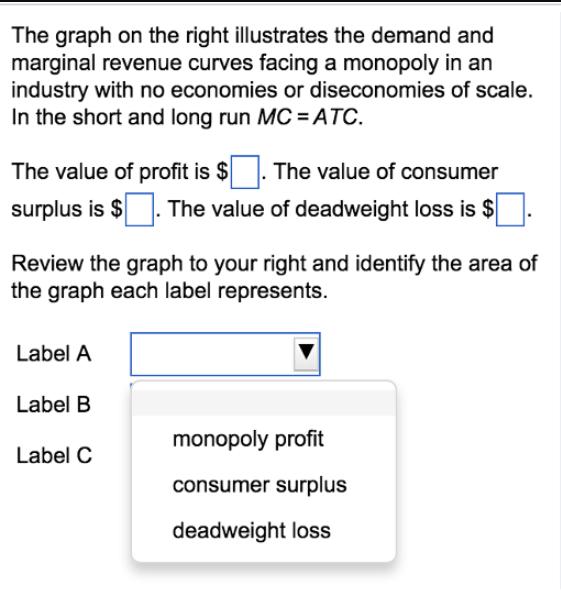
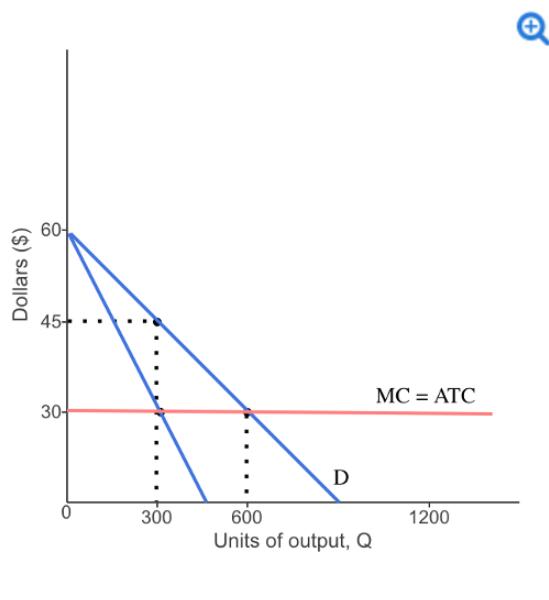
The graph on the right illustrates the demand and marginal revenue curves facing a monopoly in an industry with no economies or diseconomies of


The graph on the right illustrates the demand and marginal revenue curves facing a monopoly in an industry with no economies or diseconomies of scale. In the short and long run MC = ATC. The value of profit is $. The value of consumer surplus is $. The value of deadweight loss is $ Review the graph to your right and identify the area of the graph each label represents. Label A Label B Label C monopoly profit consumer surplus deadweight loss Dollars ($) 60- 45+ 30- 300 D 600 Units of output, Q MC = ATC 1200
Step by Step Solution
3.42 Rating (152 Votes )
There are 3 Steps involved in it
Step: 1
Label A represents the monopoly profit This is the shaded area abo...
Get Instant Access to Expert-Tailored Solutions
See step-by-step solutions with expert insights and AI powered tools for academic success
Step: 2

Step: 3

Ace Your Homework with AI
Get the answers you need in no time with our AI-driven, step-by-step assistance
Get StartedRecommended Textbook for
Intermediate Microeconomics
Authors: Hal R. Varian
9th edition
978-0393123975, 393123979, 393123960, 978-0393919677, 393919676, 978-0393123968
Students also viewed these Economics questions
Question
Answered: 1 week ago
Question
Answered: 1 week ago
Question
Answered: 1 week ago
Question
Answered: 1 week ago
Question
Answered: 1 week ago
Question
Answered: 1 week ago
Question
Answered: 1 week ago
Question
Answered: 1 week ago
Question
Answered: 1 week ago
Question
Answered: 1 week ago
Question
Answered: 1 week ago
Question
Answered: 1 week ago
Question
Answered: 1 week ago
Question
Answered: 1 week ago
Question
Answered: 1 week ago
Question
Answered: 1 week ago
Question
Answered: 1 week ago
Question
Answered: 1 week ago
Question
Answered: 1 week ago
Question
Answered: 1 week ago
Question
Answered: 1 week ago
Question
Answered: 1 week ago
View Answer in SolutionInn App


