Question
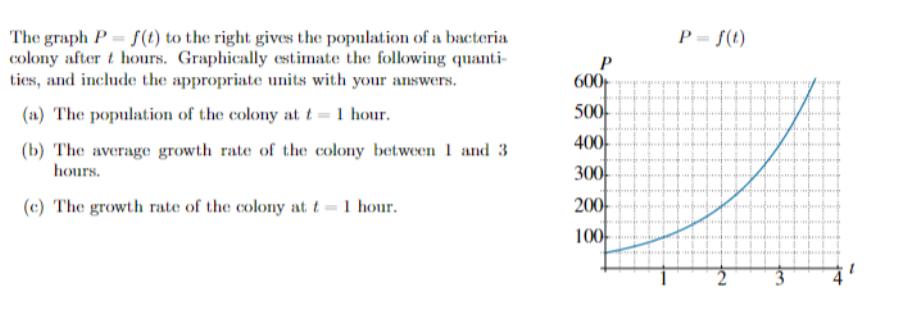
The graph P= f(t) to the right gives the population of a bacteria colony after t hours. Graphically estimate the following quanti- ties, and

The graph P= f(t) to the right gives the population of a bacteria colony after t hours. Graphically estimate the following quanti- ties, and include the appropriate units with your answers. (a) The population of the colony at t = 1 hour. (b) The average growth rate of the colony between 1 and 3 hours. (c) The growth rate of the colony at t = 1 hour. P 600 500 400 300 200 100 P = f(t) N Im
Step by Step Solution
3.27 Rating (153 Votes )
There are 3 Steps involved in it
Step: 1
so function NOW t1 b C Popution of bacteria i...
Get Instant Access to Expert-Tailored Solutions
See step-by-step solutions with expert insights and AI powered tools for academic success
Step: 2

Step: 3

Ace Your Homework with AI
Get the answers you need in no time with our AI-driven, step-by-step assistance
Get StartedRecommended Textbook for
Calculus Early Transcendentals
Authors: William L. Briggs, Lyle Cochran, Bernard Gillett
2nd edition
321954428, 321954424, 978-0321947345
Students also viewed these Accounting questions
Question
Answered: 1 week ago
Question
Answered: 1 week ago
Question
Answered: 1 week ago
Question
Answered: 1 week ago
Question
Answered: 1 week ago
Question
Answered: 1 week ago
Question
Answered: 1 week ago
Question
Answered: 1 week ago
Question
Answered: 1 week ago
Question
Answered: 1 week ago
Question
Answered: 1 week ago
Question
Answered: 1 week ago
Question
Answered: 1 week ago
Question
Answered: 1 week ago
Question
Answered: 1 week ago
Question
Answered: 1 week ago
Question
Answered: 1 week ago
Question
Answered: 1 week ago
Question
Answered: 1 week ago
Question
Answered: 1 week ago
Question
Answered: 1 week ago
Question
Answered: 1 week ago
View Answer in SolutionInn App


