Question
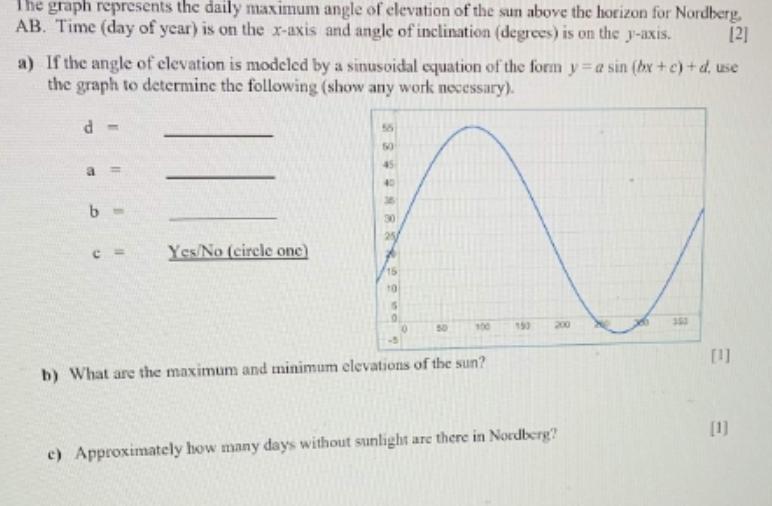
The graph represents the daily maximum angle of elevation of the sun above the horizon for Nordberg, AB. Time (day of year) is on

The graph represents the daily maximum angle of elevation of the sun above the horizon for Nordberg, AB. Time (day of year) is on the x-axis and angle of inclination (degrees) is on the y-axis. [2] a) If the angle of elevation is modeled by a sinusoidal equation of the form y=a sin (bx+c)+d, use the graph to determine the following (show any work necessary). d- b- Yes/No (circle one) 50 40 100 150 200 353 b) What are the maximum and minimum elevations of the sun? e) Approximately how many days without sunlight are there in Nordberg? [1] [1]
Step by Step Solution
There are 3 Steps involved in it
Step: 1

Get Instant Access to Expert-Tailored Solutions
See step-by-step solutions with expert insights and AI powered tools for academic success
Step: 2

Step: 3

Ace Your Homework with AI
Get the answers you need in no time with our AI-driven, step-by-step assistance
Get StartedRecommended Textbook for
College Algebra
Authors: Robert F Blitzer
7th Edition
013449492X, 9780134453262
Students also viewed these Mathematics questions
Question
Answered: 1 week ago
Question
Answered: 1 week ago
Question
Answered: 1 week ago
Question
Answered: 1 week ago
Question
Answered: 1 week ago
Question
Answered: 1 week ago
Question
Answered: 1 week ago
Question
Answered: 1 week ago
Question
Answered: 1 week ago
Question
Answered: 1 week ago
Question
Answered: 1 week ago
Question
Answered: 1 week ago
Question
Answered: 1 week ago
Question
Answered: 1 week ago
Question
Answered: 1 week ago
Question
Answered: 1 week ago
Question
Answered: 1 week ago
Question
Answered: 1 week ago
Question
Answered: 1 week ago
Question
Answered: 1 week ago
View Answer in SolutionInn App


