

Question
The graph shows how Daisy's utility changes as she consumes candy. Based on the preferences shown in the graph, arrange the pieces of candy from

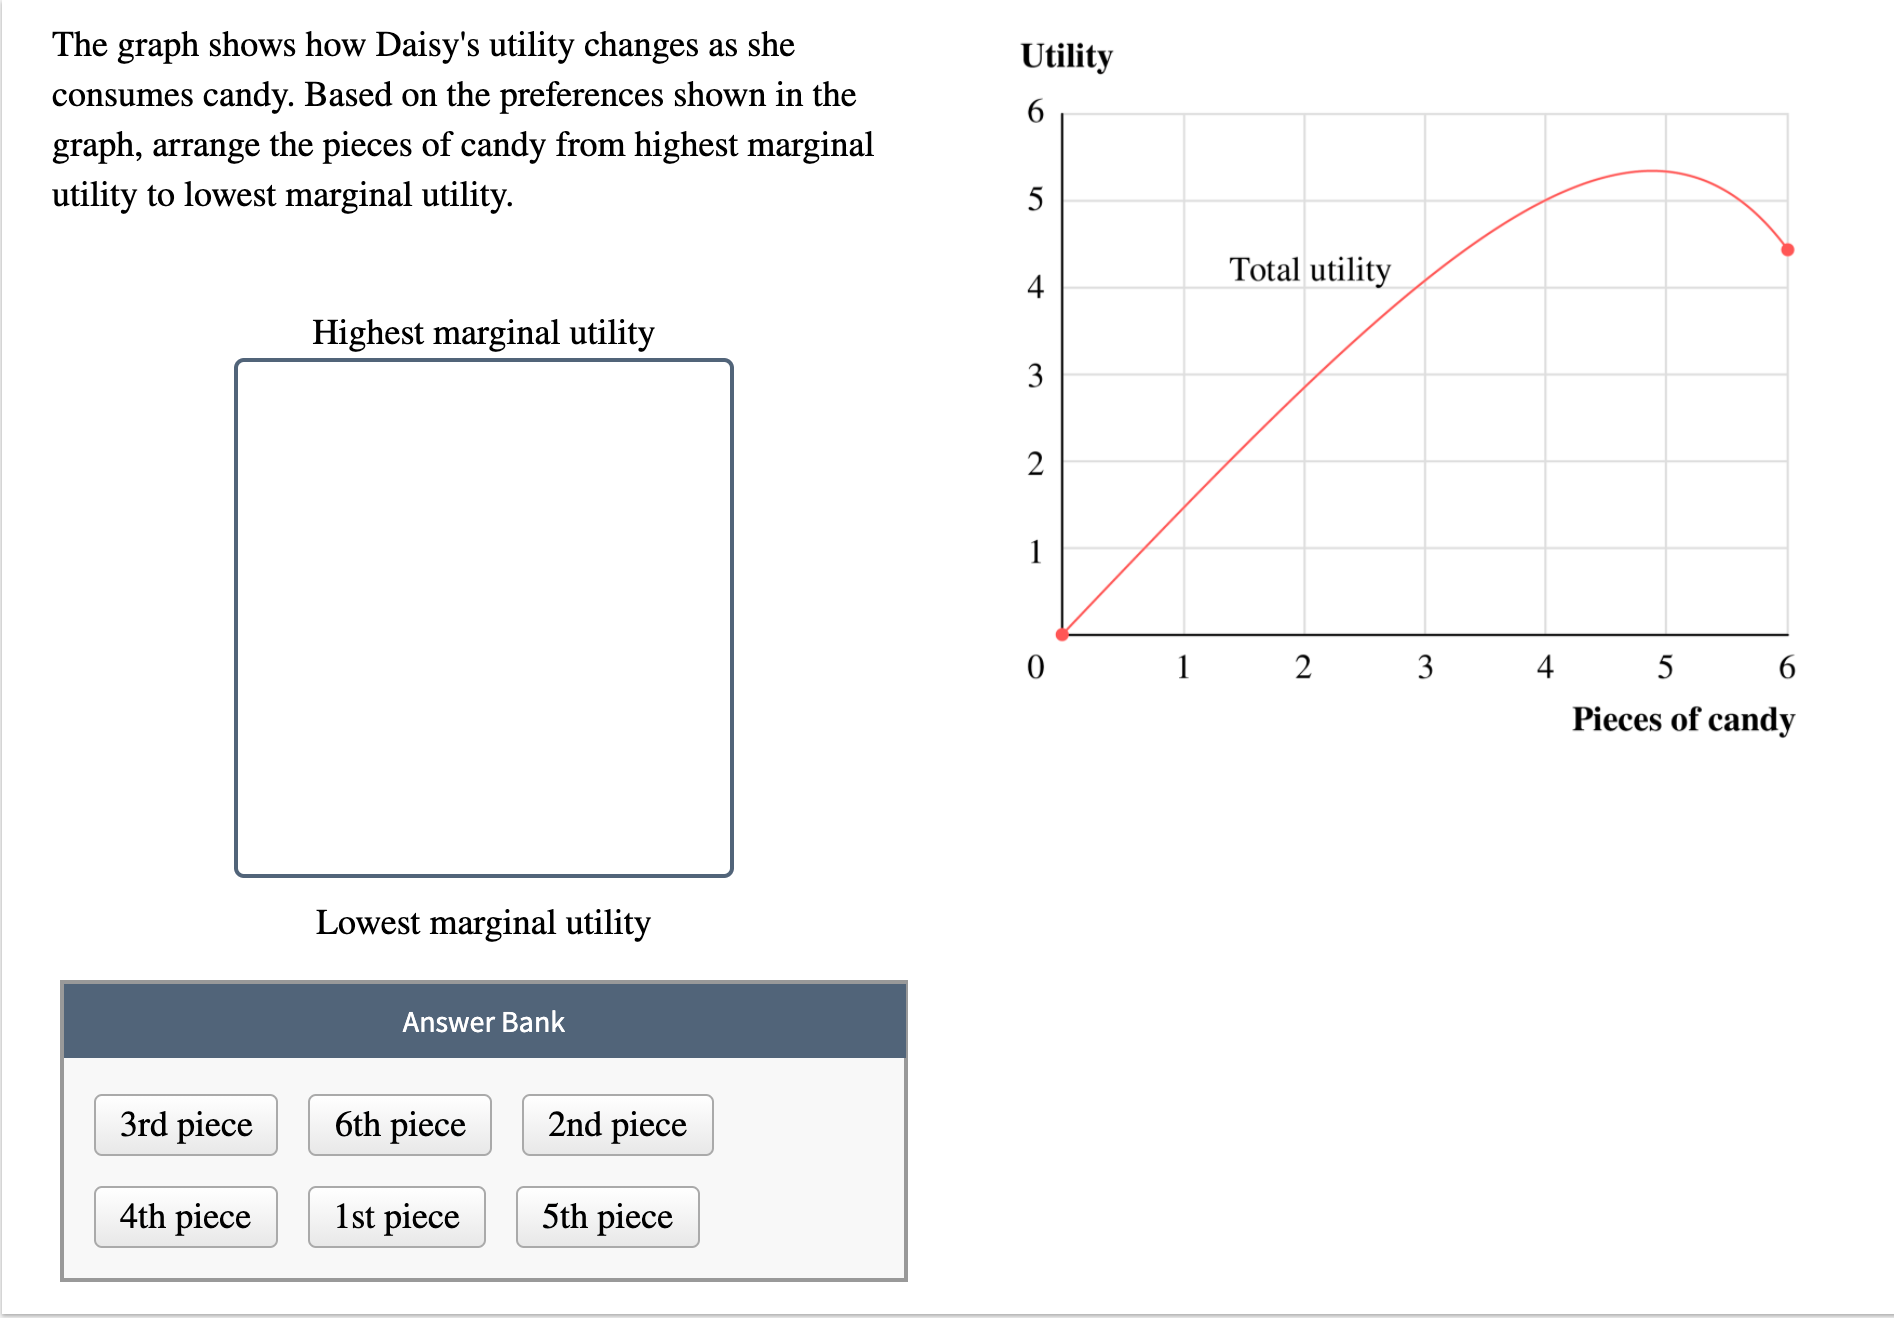
The graph shows how Daisy's utility changes as she consumes candy. Based on the preferences shown in the graph, arrange the pieces of candy from highest marginal utility to lowest marginalutility.
We have to use the pieces of candy which are provided in the answer bank to arrange the level of marginal utility from the highest to the lowest.
Step by Step Solution
There are 3 Steps involved in it
Step: 1

Get Instant Access to Expert-Tailored Solutions
See step-by-step solutions with expert insights and AI powered tools for academic success
Step: 2

Step: 3
Ace Your Homework with AI
Get the answers you need in no time with our AI-driven, step-by-step assistance
Get Started
E Marketing
Authors: Raymond Frost
7th Edition INTERNATIONAL EDITION
0132953443, 978-0132953443