

Answered step by step
Verified Expert Solution
Question
1 Approved Answer
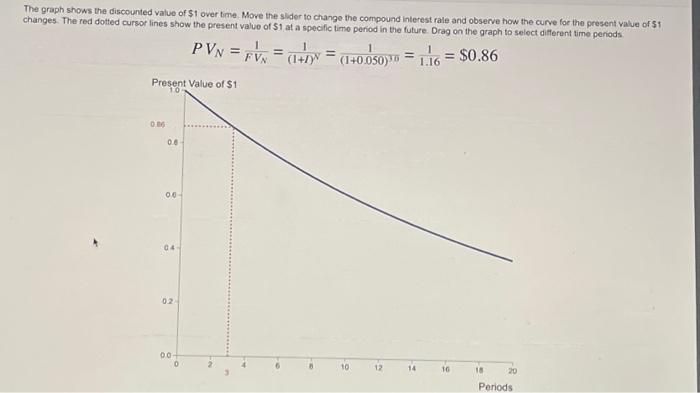
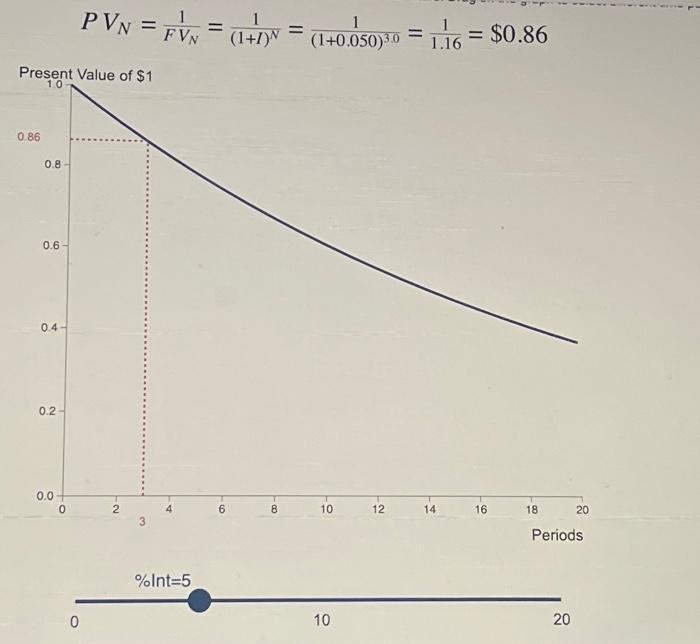
The graph shows the discounted value of $1 over time. Move the slider to change the compound interest rate and observe how the curve for
The graph shows the discounted value of $1 over time. Move the slider to change the compound interest rate and observe how the curve for the present value of $1 changes. The red dotted cursor lines show the present value of $1 at a specific time period in the future. Drag on the graph to select different time periods. Present Value of $1 1.0 0.86 0.8 0.6- 04- 0.2- 0.0- PVN = FV = = (1+ 0 4 6 1 (1+1)N 8 (1+0.050) 3.0 = 1.16 = $0.86 10 2 12 14 16 18 20 Periods
Step by Step Solution
There are 3 Steps involved in it
Step: 1

Get Instant Access to Expert-Tailored Solutions
See step-by-step solutions with expert insights and AI powered tools for academic success
Step: 2

Step: 3
Ace Your Homework with AI
Get the answers you need in no time with our AI-driven, step-by-step assistance
Get Started
Finance for Executives Managing for Value Creation
Authors: Gabriel Hawawini, Claude Viallet
4th edition