Answered step by step
Verified Expert Solution
Question
1 Approved Answer
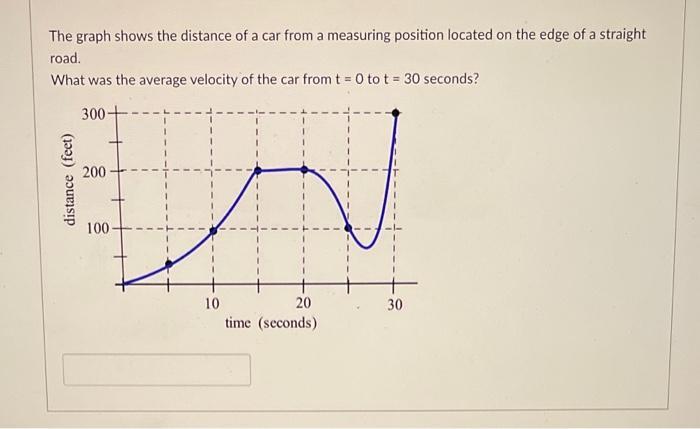
The graph shows the distance of a car from a measuring position located on the edge of a straight road. What was the average


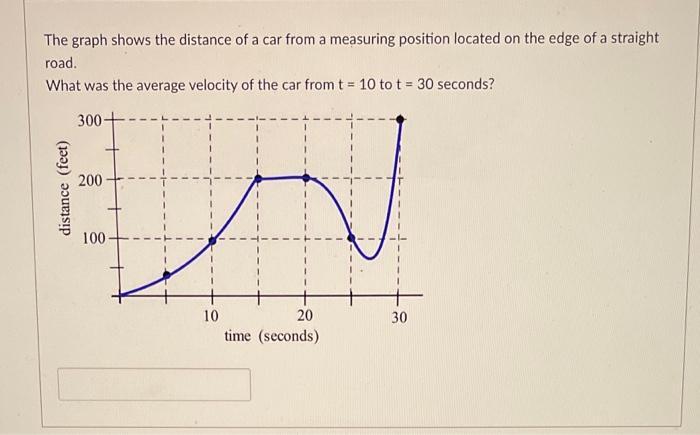
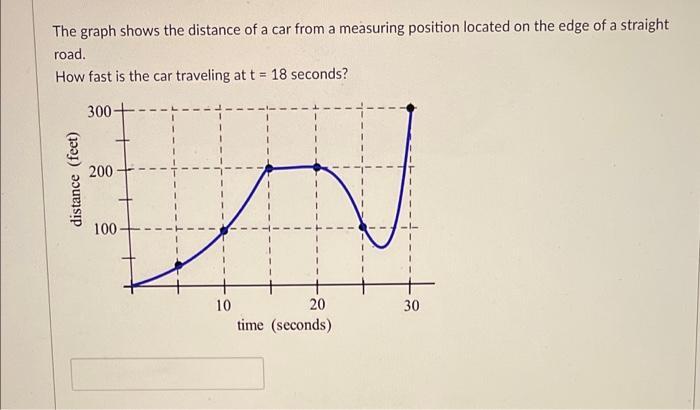
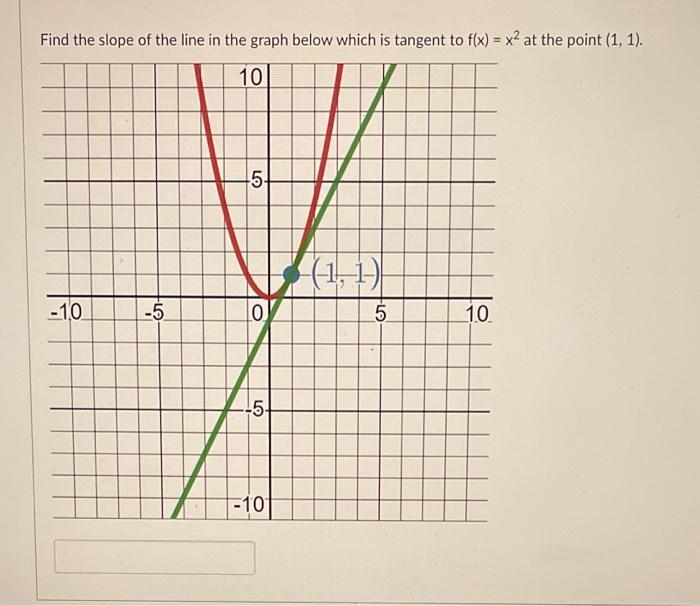
The graph shows the distance of a car from a measuring position located on the edge of a straight road. What was the average velocity of the car from t = 0 to t= 30 seconds? 300- distance (feet) 200- 100- 10 20 time (seconds) 30 The graph shows the distance of a car from a measuring position located on the edge of a straight road. What was the average velocity of the car from t = 10 to t = 30 seconds? 300- distance (feet) 200 100- 10 20 time (seconds) 30 The graph shows the distance of a car from a measuring position located on the edge of a straight road. How fast is the car traveling at t = 18 seconds? 300- distance (feet) 200- 100- 10 20 time (seconds) 30 Find the slope of the line in the graph below which is tangent to f(x) = x at the point (1, 1). 10 -10 -5 LO 5 0 -5- -10 5 1.0
Step by Step Solution
★★★★★
3.27 Rating (142 Votes )
There are 3 Steps involved in it
Step: 1
1From the graphwe can see that the cars distance from the measuring position increases from 0 to 300 feet in 30 secondsThis means that the cars averag...
Get Instant Access to Expert-Tailored Solutions
See step-by-step solutions with expert insights and AI powered tools for academic success
Step: 2

Step: 3

Ace Your Homework with AI
Get the answers you need in no time with our AI-driven, step-by-step assistance
Get Started


