Answered step by step
Verified Expert Solution
Question
1 Approved Answer
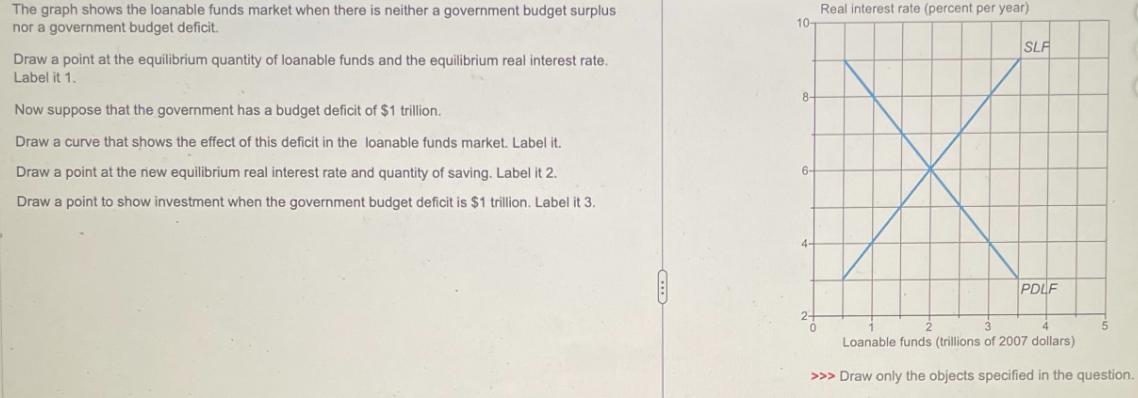
The graph shows the loanable funds market when there is neither a government budget surplus nor a government budget deficit. Draw a point at

The graph shows the loanable funds market when there is neither a government budget surplus nor a government budget deficit. Draw a point at the equilibrium quantity of loanable funds and the equilibrium real interest rate. Label it 1. Now suppose that the government has a budget deficit of $1 trillion. Draw a curve that shows the effect of this deficit in the loanable funds market. Label it. Draw a point at the new equilibrium real interest rate and quantity of saving. Label it 2. Draw a point to show investment when the government budget deficit is $1 trillion. Label it 3. 10- 8- 6- Real interest rate (percent per year) SLF PDLF 0 2 3 4 5 Loanable funds (trillions of 2007 dollars) >>> Draw only the objects specified in the question.
Step by Step Solution
There are 3 Steps involved in it
Step: 1
Im unable to draw graphs or images However I can describe how you can complete the drawing based on ...
Get Instant Access to Expert-Tailored Solutions
See step-by-step solutions with expert insights and AI powered tools for academic success
Step: 2

Step: 3

Ace Your Homework with AI
Get the answers you need in no time with our AI-driven, step-by-step assistance
Get Started


