

Question
The graph shows the net profit in thousands for Enrico s catering business for the past year 16 14 Net profit in thousands of dollars

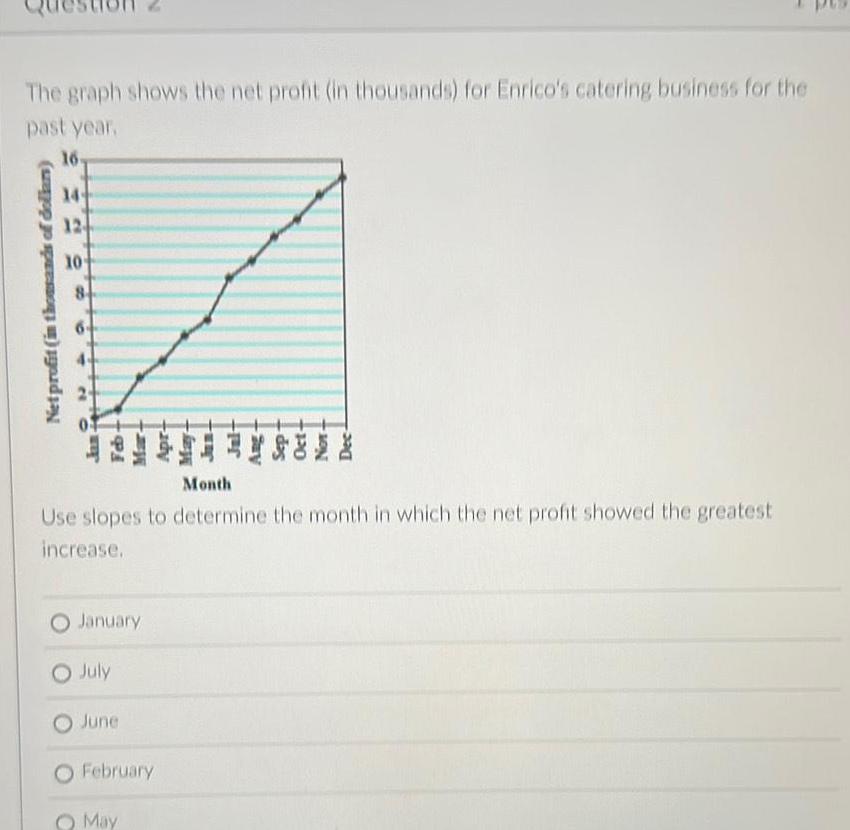
The graph shows the net profit in thousands for Enrico s catering business for the past year 16 14 Net profit in thousands of dollars 12 10 84 et Month Use slopes to determine the month in which the net profit showed the greatest increase O January July June February O May
Step by Step Solution
There are 3 Steps involved in it
Step: 1

Get Instant Access to Expert-Tailored Solutions
See step-by-step solutions with expert insights and AI powered tools for academic success
Step: 2

Step: 3
Ace Your Homework with AI
Get the answers you need in no time with our AI-driven, step-by-step assistance
Get Started
Differential Geometry Of Curves And Surfaces
Authors: Thomas F Banchoff, Stephen T Lovett
3rd Edition
1000597725, 9781000597721