Question
The graph shows the number of visitors V to a national park in hundreds of thousands during a one-year period, where t = 1 represents
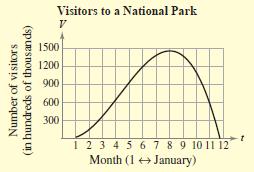
The graph shows the number of visitors V to a national park in hundreds of thousands during a one-year period, where t = 1 represents January.

(a) Estimate the rate of change of V over the interval [9, 12] and explain your results.
(b) Over what interval is the average rate of change approximately equal to the rate of change at Explain your reasoning.
Number of visitors of thousands) (in hundreds Visitors to a National Park V 1500 1200 900 600 300 1 2 3 4 5 6 7 8 9 10 11 12 Month (1 January)
Step by Step Solution
3.42 Rating (152 Votes )
There are 3 Steps involved in it
Step: 1
Step 12 a From the given graph we observe that When t 9 ie September then V1...
Get Instant Access to Expert-Tailored Solutions
See step-by-step solutions with expert insights and AI powered tools for academic success
Step: 2

Step: 3

Ace Your Homework with AI
Get the answers you need in no time with our AI-driven, step-by-step assistance
Get StartedRecommended Textbook for
Operations Management
Authors: Gerard Cachon, Christian Terwiesch
2nd International Edition
1260547612, 978-1260547610
Students also viewed these Accounting questions
Question
Answered: 1 week ago
Question
Answered: 1 week ago
Question
Answered: 1 week ago
Question
Answered: 1 week ago
Question
Answered: 1 week ago
Question
Answered: 1 week ago
Question
Answered: 1 week ago
Question
Answered: 1 week ago
Question
Answered: 1 week ago
Question
Answered: 1 week ago
Question
Answered: 1 week ago
Question
Answered: 1 week ago
Question
Answered: 1 week ago
Question
Answered: 1 week ago
Question
Answered: 1 week ago
Question
Answered: 1 week ago
Question
Answered: 1 week ago
Question
Answered: 1 week ago
Question
Answered: 1 week ago
Question
Answered: 1 week ago
View Answer in SolutionInn App


