Question
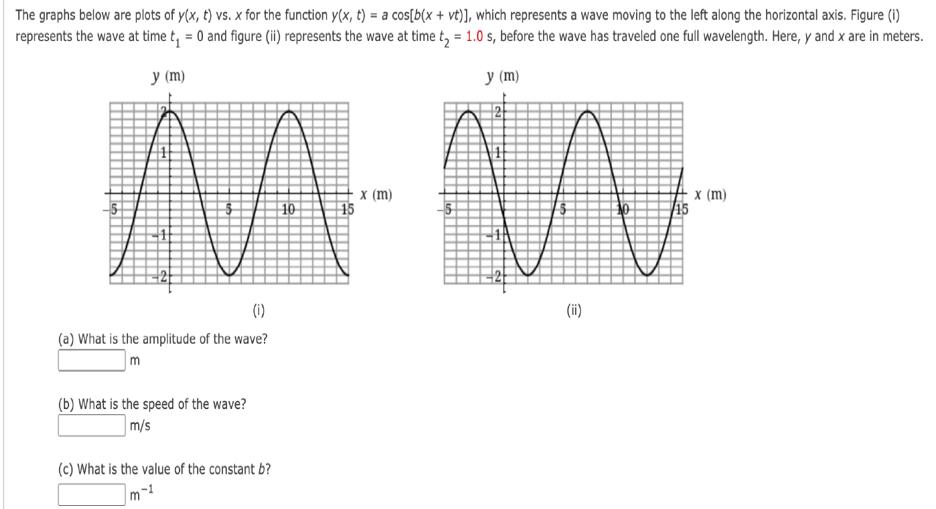
The graphs below are plots of y(x, t) vs. x for the function y(x, t) = a cos[b(x + vt)], which represents a wave

The graphs below are plots of y(x, t) vs. x for the function y(x, t) = a cos[b(x + vt)], which represents a wave moving to the left along the horizontal axis. Figure (i) represents the wave at time t = 0 and figure (ii) represents the wave at time t = 1.0 s, before the wave has traveled one full wavelength. Here, y and x are in meters. y (m) y (m) (1) (a) What is the amplitude of the wave? m (b) What is the speed of the wave? m/s (c) What is the value of the constant b? m-1 10 15 x (m) W 5 (ii) 12 15 x (m)
Step by Step Solution
3.47 Rating (150 Votes )
There are 3 Steps involved in it
Step: 1

Get Instant Access to Expert-Tailored Solutions
See step-by-step solutions with expert insights and AI powered tools for academic success
Step: 2

Step: 3

Ace Your Homework with AI
Get the answers you need in no time with our AI-driven, step-by-step assistance
Get StartedRecommended Textbook for
Fundamentals of Physics
Authors: Jearl Walker, Halliday Resnick
8th Extended edition
471758019, 978-0471758013
Students also viewed these Physics questions
Question
Answered: 1 week ago
Question
Answered: 1 week ago
Question
Answered: 1 week ago
Question
Answered: 1 week ago
Question
Answered: 1 week ago
Question
Answered: 1 week ago
Question
Answered: 1 week ago
Question
Answered: 1 week ago
Question
Answered: 1 week ago
Question
Answered: 1 week ago
Question
Answered: 1 week ago
Question
Answered: 1 week ago
Question
Answered: 1 week ago
Question
Answered: 1 week ago
Question
Answered: 1 week ago
Question
Answered: 1 week ago
Question
Answered: 1 week ago
Question
Answered: 1 week ago
Question
Answered: 1 week ago
Question
Answered: 1 week ago
Question
Answered: 1 week ago
Question
Answered: 1 week ago
Question
Answered: 1 week ago
View Answer in SolutionInn App


