Question
The graphs below represent sizes of four populations in a desert grassland with two plant species (P1 and P2) and two species of rodent

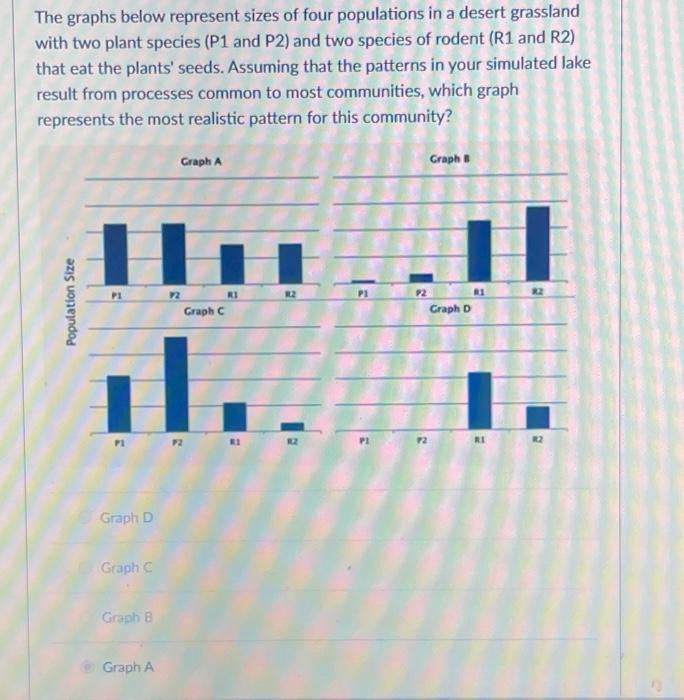
The graphs below represent sizes of four populations in a desert grassland with two plant species (P1 and P2) and two species of rodent (R1 and R2) that eat the plants' seeds. Assuming that the patterns in your simulated lake result from processes common to most communities, which graph represents the most realistic pattern for this community? Graph A Graph B P1 72 RI R2 P2 Graph C Graph D RI P1 Graph D Graph C Graph B Graph A Population Size
Step by Step Solution
There are 3 Steps involved in it
Step: 1
Topdown control is when higher trophic level has an effect on thos...
Get Instant Access to Expert-Tailored Solutions
See step-by-step solutions with expert insights and AI powered tools for academic success
Step: 2

Step: 3

Ace Your Homework with AI
Get the answers you need in no time with our AI-driven, step-by-step assistance
Get StartedRecommended Textbook for
Calculus Early Transcendentals
Authors: James Stewart
7th edition
538497904, 978-0538497909
Students also viewed these Accounting questions
Question
Answered: 1 week ago
Question
Answered: 1 week ago
Question
Answered: 1 week ago
Question
Answered: 1 week ago
Question
Answered: 1 week ago
Question
Answered: 1 week ago
Question
Answered: 1 week ago
Question
Answered: 1 week ago
Question
Answered: 1 week ago
Question
Answered: 1 week ago
Question
Answered: 1 week ago
Question
Answered: 1 week ago
Question
Answered: 1 week ago
Question
Answered: 1 week ago
Question
Answered: 1 week ago
Question
Answered: 1 week ago
Question
Answered: 1 week ago
Question
Answered: 1 week ago
Question
Answered: 1 week ago
Question
Answered: 1 week ago
Question
Answered: 1 week ago
Question
Answered: 1 week ago
View Answer in SolutionInn App


