

Answered step by step
Verified Expert Solution
Question
1 Approved Answer
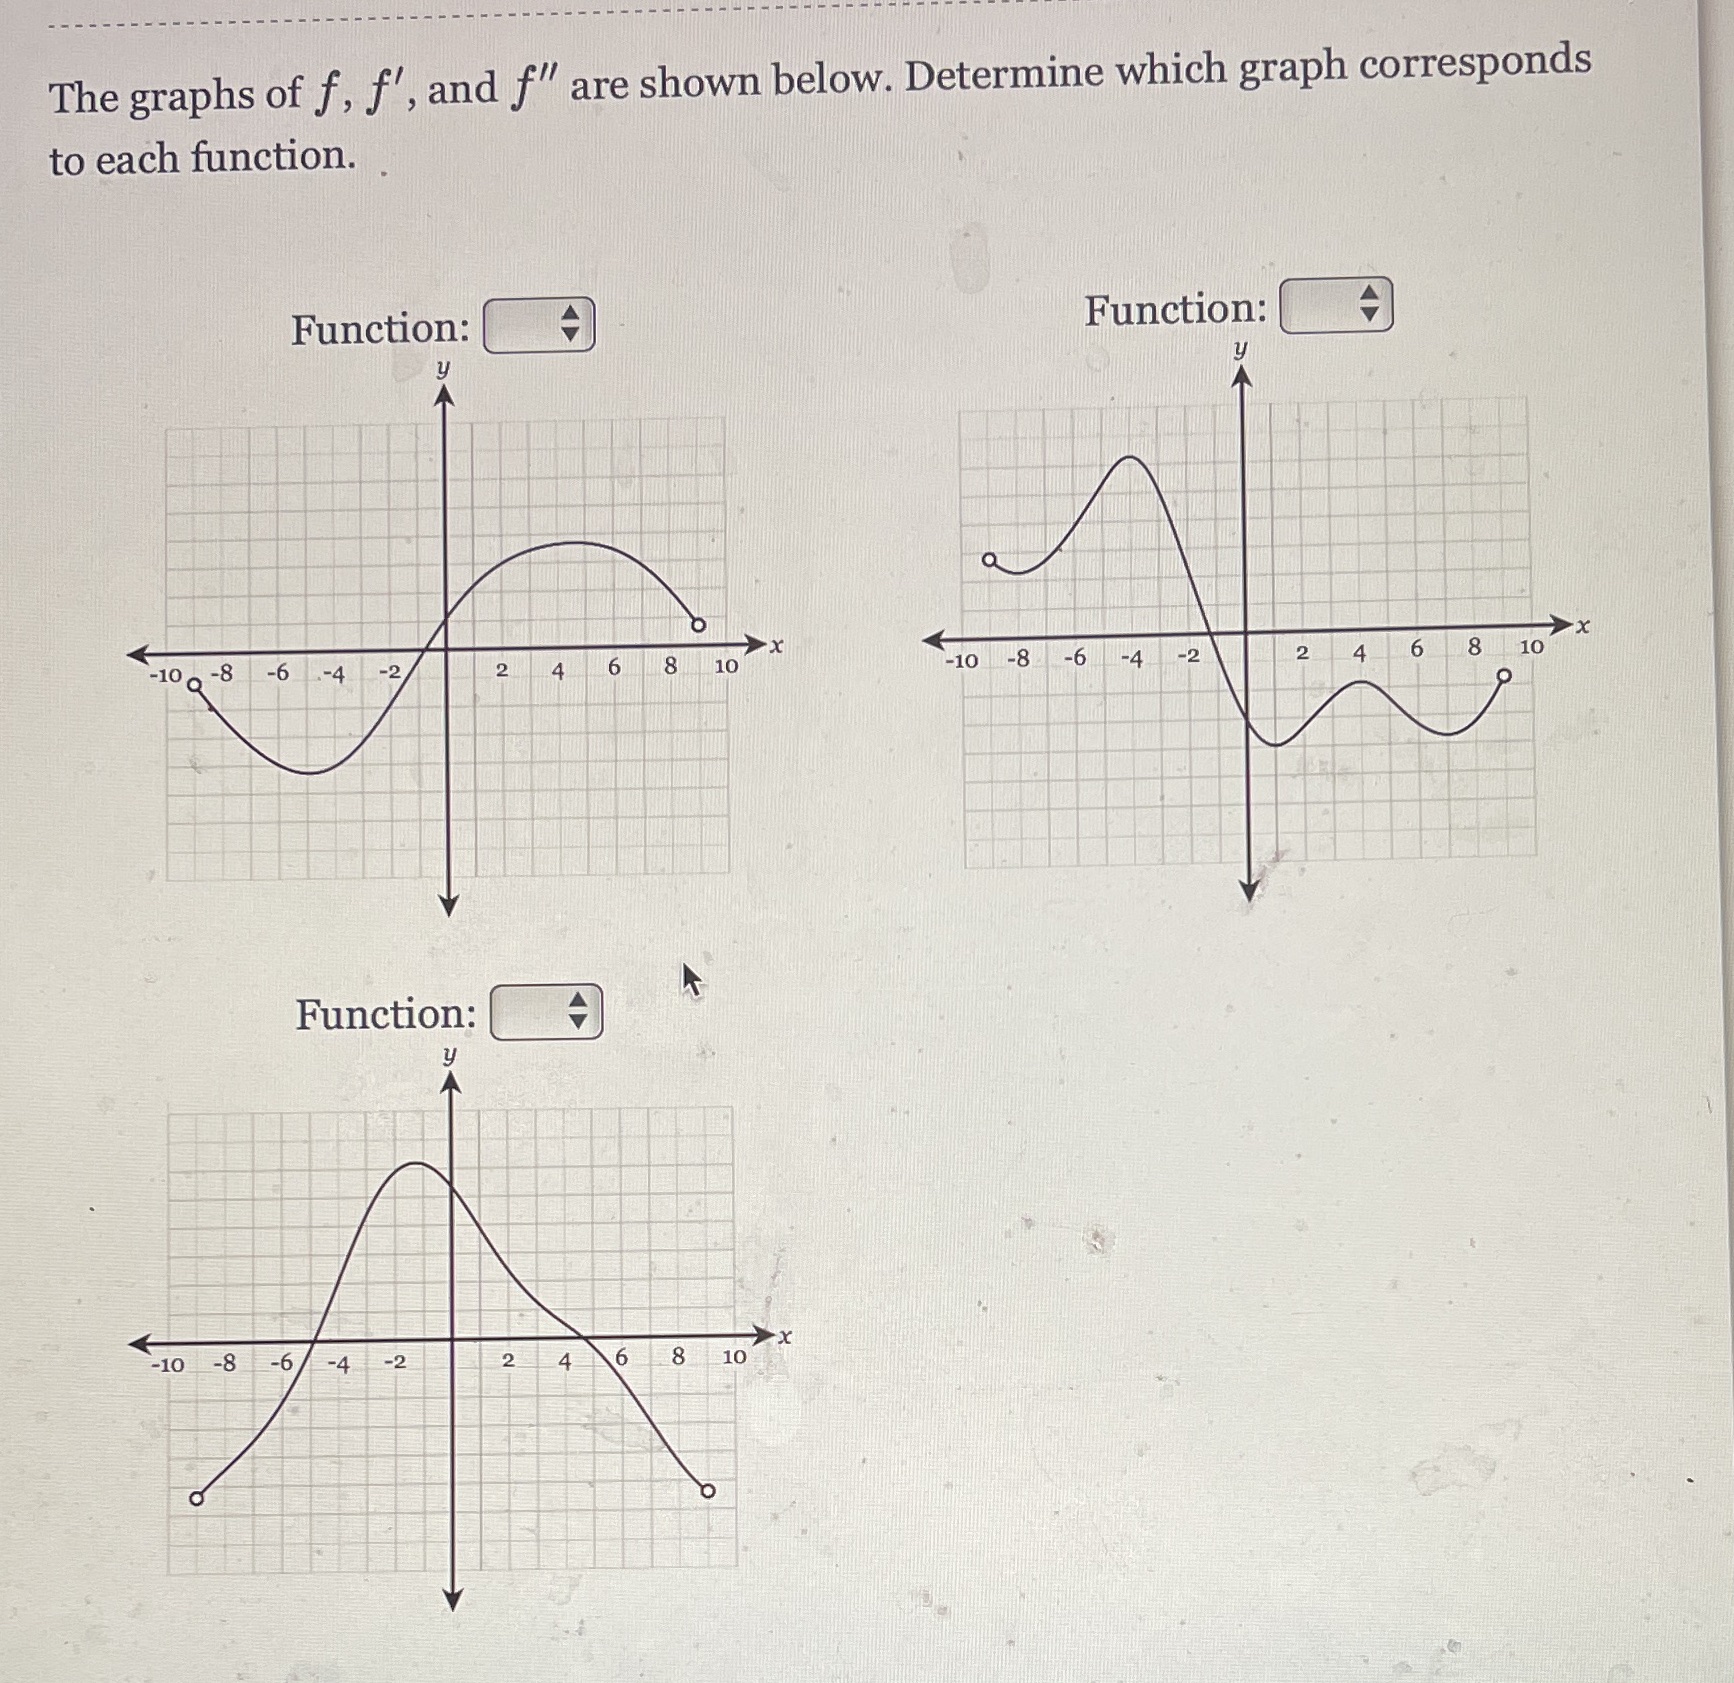
The graphs of f, f', and f are shown below. Determine which graph corresponds to each function. Function: Function: -10 Q -8 -6 -4 -2

Step by Step Solution
There are 3 Steps involved in it
Step: 1

Get Instant Access to Expert-Tailored Solutions
See step-by-step solutions with expert insights and AI powered tools for academic success
Step: 2

Step: 3
Ace Your Homework with AI
Get the answers you need in no time with our AI-driven, step-by-step assistance
Get Started
Harmonic Analysis On Exponential Solvable Lie Groups
Authors: Hidenori Fujiwara, Jean Ludwig
1st Edition
443155288X, 9784431552888