Question
The graphs of two functions y = f(x) are shown in Figure 1 below. For each of them, sketch a qualitatively accurate graphs of the

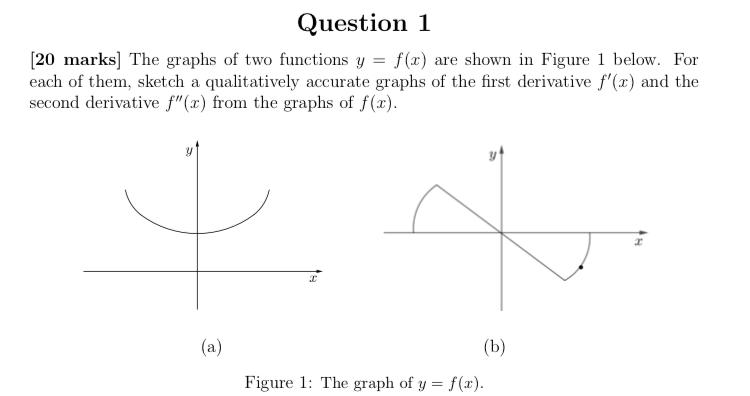
The graphs of two functions y = f(x) are shown in Figure 1 below. For each of them, sketch a qualitatively accurate graphs of the first derivative f′(x) and the second derivative f′′(x) from the graphs of f(x).
Question 1 [20 marks] The graphs of two functions y = f(x) are shown in Figure 1 below. For each of them, sketch a qualitatively accurate graphs of the first derivative f'(x) and the second derivative f"(x) from the graphs of f(x). (a) (b) Figure 1: The graph of y = f(r).
Step by Step Solution
3.42 Rating (158 Votes )
There are 3 Steps involved in it
Step: 1

Get Instant Access to Expert-Tailored Solutions
See step-by-step solutions with expert insights and AI powered tools for academic success
Step: 2

Step: 3

Ace Your Homework with AI
Get the answers you need in no time with our AI-driven, step-by-step assistance
Get StartedRecommended Textbook for
Mathematical Applications for the Management Life and Social Sciences
Authors: Ronald J. Harshbarger, James J. Reynolds
11th edition
9781337032247, 9781305465183, 1305108043, 1337032247, 1305465180, 978-1305108042
Students also viewed these Mathematics questions
Question
Answered: 1 week ago
Question
Answered: 1 week ago
Question
Answered: 1 week ago
Question
Answered: 1 week ago
Question
Answered: 1 week ago
Question
Answered: 1 week ago
Question
Answered: 1 week ago
Question
Answered: 1 week ago
Question
Answered: 1 week ago
Question
Answered: 1 week ago
Question
Answered: 1 week ago
Question
Answered: 1 week ago
Question
Answered: 1 week ago
Question
Answered: 1 week ago
Question
Answered: 1 week ago
Question
Answered: 1 week ago
Question
Answered: 1 week ago
Question
Answered: 1 week ago
Question
Answered: 1 week ago
Question
Answered: 1 week ago
Question
Answered: 1 week ago
View Answer in SolutionInn App


