Answered step by step
Verified Expert Solution
Question
1 Approved Answer
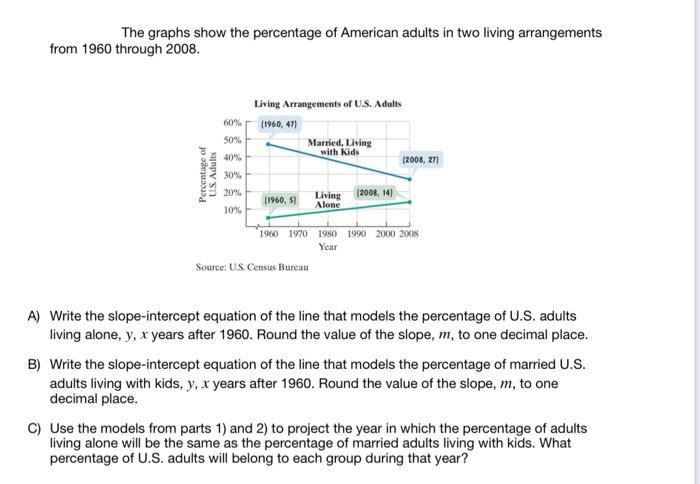
The graphs show the percentage of American adults in two living arrangements from 1960 through 2008. Percentage of U.S. Adults 60% 50% 40% 30%

The graphs show the percentage of American adults in two living arrangements from 1960 through 2008. Percentage of U.S. Adults 60% 50% 40% 30% 20% 10% Living Arrangements of U.S. Adults (1960, 47) (1960, 5) Married, Living with Kids Living (2008, 14) Alone Source: U.S. Census Bureau (2008, 27) 1960 1970 1980 1990 2000 2008 Year A) Write the slope-intercept equation of the line that models the percentage of U.S. adults living alone, y, x years after 1960. Round the value of the slope, m, to one decimal place. B) Write the slope-intercept equation of the line that models the percentage of married U.S. adults living with kids, y, x years after 1960. Round the value of the slope, m, to one decimal place. C) Use the models from parts 1) and 2) to project the year in which the percentage of adults living alone will be the same as the percentage of married adults living with kids. What percentage of U.S. adults will belong to each group during that year?
Step by Step Solution
★★★★★
3.34 Rating (154 Votes )
There are 3 Steps involved in it
Step: 1

Get Instant Access to Expert-Tailored Solutions
See step-by-step solutions with expert insights and AI powered tools for academic success
Step: 2

Step: 3

Ace Your Homework with AI
Get the answers you need in no time with our AI-driven, step-by-step assistance
Get Started


