

Answered step by step
Verified Expert Solution
Question
1 Approved Answer
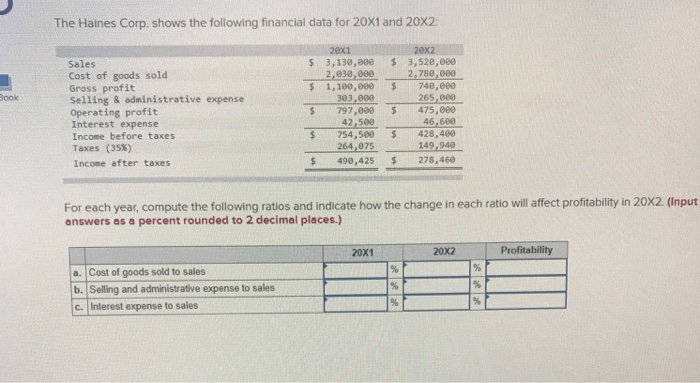
The Haines Corp. shows the following financial data for 20X1 and 20x2: 5 $ $ $ Sales Cost of goods sold Gross profit Selling &
Step by Step Solution
There are 3 Steps involved in it
Step: 1

Get Instant Access to Expert-Tailored Solutions
See step-by-step solutions with expert insights and AI powered tools for academic success
Step: 2

Step: 3
Ace Your Homework with AI
Get the answers you need in no time with our AI-driven, step-by-step assistance
Get Started
Protecting Main Street Measuring The Customer Experience In Financial Services For Business And Public Policy
Authors: Paul C. Lubin
1st Edition
1138864161,1136902546