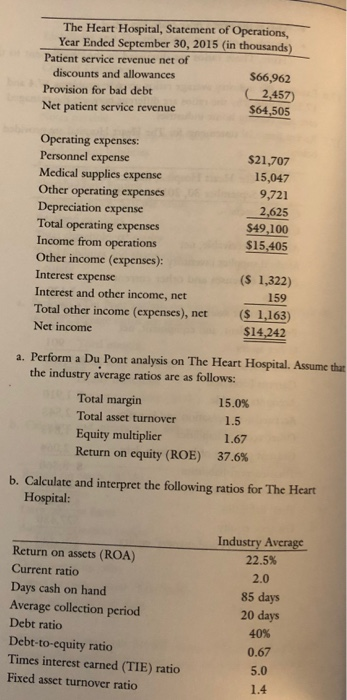
The Heart Hospital, Statement of Operations, Year Ended September 30, 2015 (in thousands) Patient service revenue net of discounts and allowances $66,962 Provision for bad debt (_2,457 Net patient service revenue $64,505 Operating expenses: Personnel expense Medical supplies expense Other operating expenses Depreciation expense Total operating expenses Income from operations Other income (expenses): Interest expense Interest and other income, net Total other income (expenses), net Net income $21,707 15,047 9,721 2,625 $49,100 $15,405 ($ 1,322) 159 ($ 1,163) $14,242 a. Perform a Du Pont analysis on The Heart Hospital. Assume that the industry average ratios are as follows: Total margin 15.0% Total asset turnover 1.5 Equity multiplier 1.67 Return on equity (ROE) 37.6% b. Calculate and interpret the following ratios for The Heart Hospital: Return on assets (ROA) Current ratio Days cash on hand Average collection period Debt ratio Debt-to-equity ratio Times interest earned (TIE) ratio Fixed asset turnover ratio Industry Average 22.5% 2.0 85 days 20 days 40% 0.67 5.0 1.4 The Heart Hospital, Statement of Operations, Year Ended September 30, 2015 (in thousands) Patient service revenue net of discounts and allowances $66,962 Provision for bad debt (_2,457 Net patient service revenue $64,505 Operating expenses: Personnel expense Medical supplies expense Other operating expenses Depreciation expense Total operating expenses Income from operations Other income (expenses): Interest expense Interest and other income, net Total other income (expenses), net Net income $21,707 15,047 9,721 2,625 $49,100 $15,405 ($ 1,322) 159 ($ 1,163) $14,242 a. Perform a Du Pont analysis on The Heart Hospital. Assume that the industry average ratios are as follows: Total margin 15.0% Total asset turnover 1.5 Equity multiplier 1.67 Return on equity (ROE) 37.6% b. Calculate and interpret the following ratios for The Heart Hospital: Return on assets (ROA) Current ratio Days cash on hand Average collection period Debt ratio Debt-to-equity ratio Times interest earned (TIE) ratio Fixed asset turnover ratio Industry Average 22.5% 2.0 85 days 20 days 40% 0.67 5.0 1.4


