Question
The highly successful national chain Tea & Tech, offers its customers an opportunity to enjoy sustainably grown and processed beverages while tinkering with their favorite
The highly successful national chain Tea & Tech, offers its customers an opportunity to enjoy sustainably grown and processed beverages while tinkering with their favorite technology products. Each store employs both a barista crew and a tech squad. The company prides itself on its laidback environment and friendly services.
The company has decided to study the internal movement patterns of employees at the store level, as well as forecast their likely availabilities in future time periods. The results will be used to help identify staffing gaps (surpluses and shortages) and to develop staffing strategy and plans for future growth.
Your VP of Talent Acquisitions, Jaime Wells, has requested your assistance in the preparation of an HR planning analysis for the company’s units in the state of Rhode Island. Once overall goals are developed for Rhode Island, a policy will be disseminated nationwide. Data from the individual stores will then be sent to the corporate offices for further analysis and re-evaluation.
The basic forecasting model for planning HR activities includes (1) forecasting labor requirements, (2) forecasting labor availabilities, (3) conducting environmental scans, (4) determining gaps, and (5) developing action plans. These steps are described in Staffing Organizations. Conducting an adequate human resources selection plan will require you to take all of these steps.
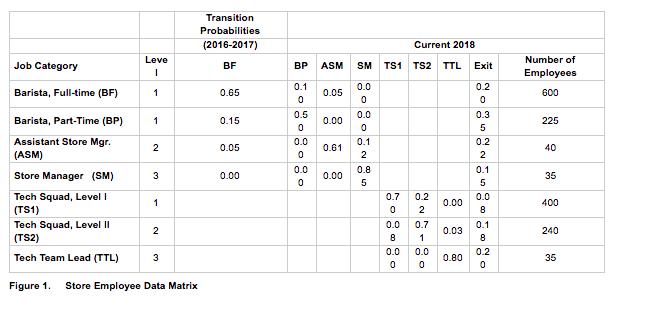
To start your forecast, you have been given historical data presented in the transition probability matrix (Figure 1). The transition probability matrix was developed based on the historical staffing pattern for Rhode Island over the past five years. A first stage of investigating staffing is to use the previous years’ staffing patterns as a preliminary forecast of labor requirements, the internal availability based on retention, internal promotions, transfers and demotions, and a determination of gaps by subtracting forecasted availabilities from future requirements.
To do this, the HR department first collected data for 2016 and 2017 to construct a transition probability matrix, as well as the number of employees for 2018 in each job category. It now wants to use the matrix to forecast availabilities for 2019.
Using the information in Figure 1, forecast the numbers available in each job category in 2019 by completing the table below. Please present your numbers in a table format like the one below. Indicate two potential limitations to your forecast and Compute year end totals for each job category.
Category | 2018 Total Employees | BF | BP | ASM | SM | TS1 | TS2 | TTL | 2019 Estimated Total | |
BF | ||||||||||
BP | ||||||||||
ASM | ||||||||||
SM | ||||||||||
TS1 | ||||||||||
TS2 | ||||||||||
TTL | ||||||||||
Year End Totals | ||||||||||

Job Category Barista, Full-time (BF) Barista, Part-Time (BP) Assistant Store Mgr. (ASM) Store Manager (SM) Tech Squad, Level 1 (TS1) Leve 1 1 1 2 3 1 Tech Squad, Level II (TS2) Tech Team Lead (TTL) Figure 1. Store Employee Data Matrix 2 3 Transition Probabilities (2016-2017) BF 0.65 0.15 0.05 0.00 BP ASM 0.1 0 0.5 0 0.0 0 0.0 0 0.05 0.00 0.61 0.00 Current 2018 SM TS1 TS2 TTL Exit 0.0 0 0.0 0 0.1 2 0.8 5 0.7 0 0.0 8 0.0 0 0.2 2 0.7 1 0.0 0 0.00 0.03 0.80 0.2 0 0.3 5 0.2 2 0.1 5 0.0 8 0.1 8 0.2 0 Number of Employees 600 225 40 35 400 240 35
Step by Step Solution
There are 3 Steps involved in it
Step: 1
Forecasted availabilities for 2019 Category2018 To...
Get Instant Access to Expert-Tailored Solutions
See step-by-step solutions with expert insights and AI powered tools for academic success
Step: 2

Step: 3

Ace Your Homework with AI
Get the answers you need in no time with our AI-driven, step-by-step assistance
Get Started


