Question
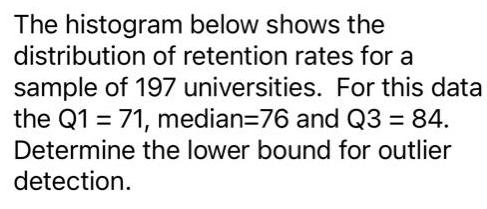
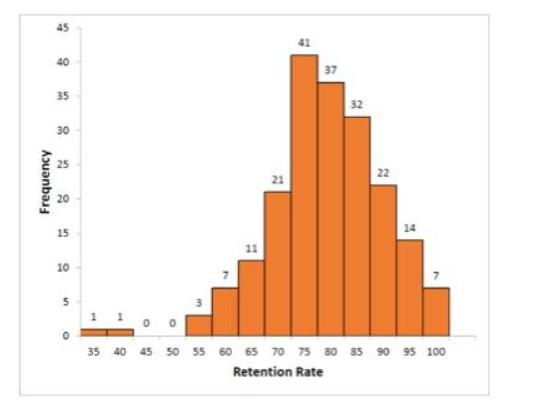
The histogram below shows the distribution of retention rates for a sample of 197 universities. For this data the Q1 = 71, median=76 and


The histogram below shows the distribution of retention rates for a sample of 197 universities. For this data the Q1 = 71, median=76 and Q3 = 84. Determine the lower bound for outlier detection. Frequency 45 40 35 30 25 20 15 10 5 O 1 0 O in 7 11 21 41 37 32 22 14 D 35 40 45 50 55 60 65 70 75 80 85 90 95 100 Retention Rate
Step by Step Solution
3.41 Rating (154 Votes )
There are 3 Steps involved in it
Step: 1
The answer provided below has been developed in a clear step by step m...
Get Instant Access to Expert-Tailored Solutions
See step-by-step solutions with expert insights and AI powered tools for academic success
Step: 2

Step: 3

Ace Your Homework with AI
Get the answers you need in no time with our AI-driven, step-by-step assistance
Get StartedRecommended Textbook for
Stats Data And Models
Authors: Richard D. De Veaux, Paul D. Velleman, David E. Bock
4th Edition
321986490, 978-0321989970, 032198997X, 978-0321986498
Students also viewed these Accounting questions
Question
Answered: 1 week ago
Question
Answered: 1 week ago
Question
Answered: 1 week ago
Question
Answered: 1 week ago
Question
Answered: 1 week ago
Question
Answered: 1 week ago
Question
Answered: 1 week ago
Question
Answered: 1 week ago
Question
Answered: 1 week ago
Question
Answered: 1 week ago
Question
Answered: 1 week ago
Question
Answered: 1 week ago
Question
Answered: 1 week ago
Question
Answered: 1 week ago
Question
Answered: 1 week ago
Question
Answered: 1 week ago
Question
Answered: 1 week ago
Question
Answered: 1 week ago
Question
Answered: 1 week ago
Question
Answered: 1 week ago
Question
Answered: 1 week ago
View Answer in SolutionInn App


