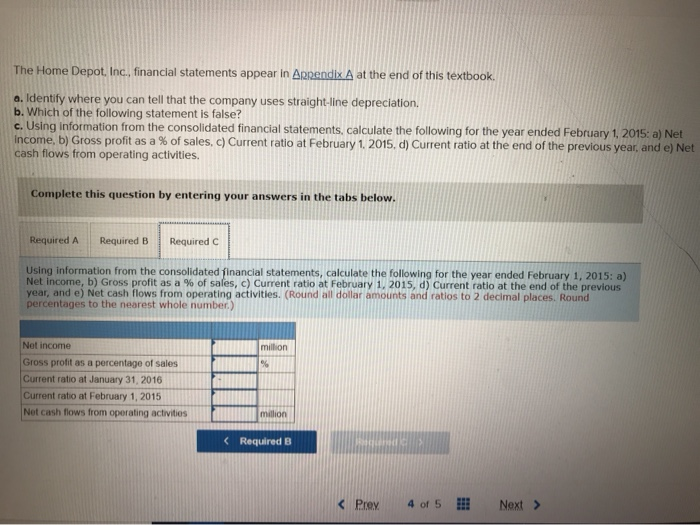
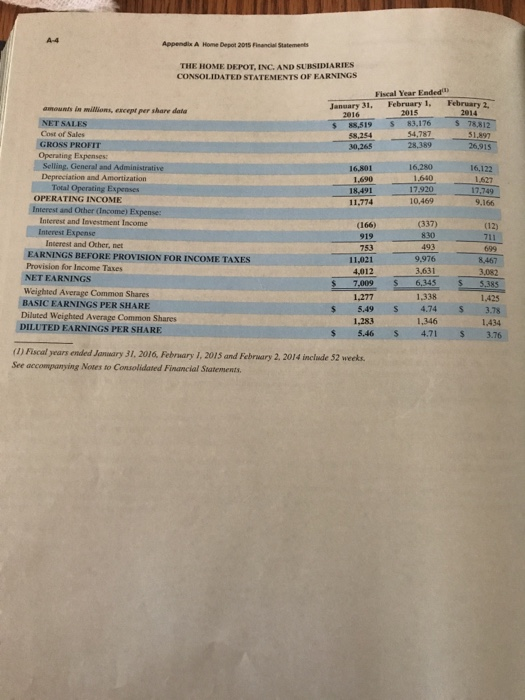
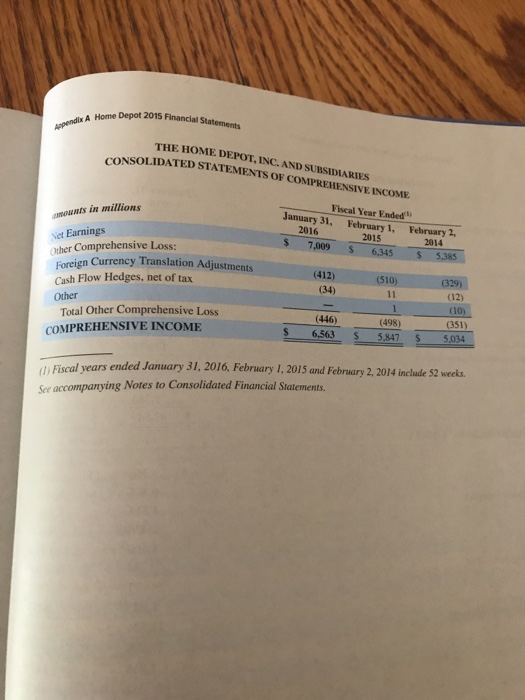
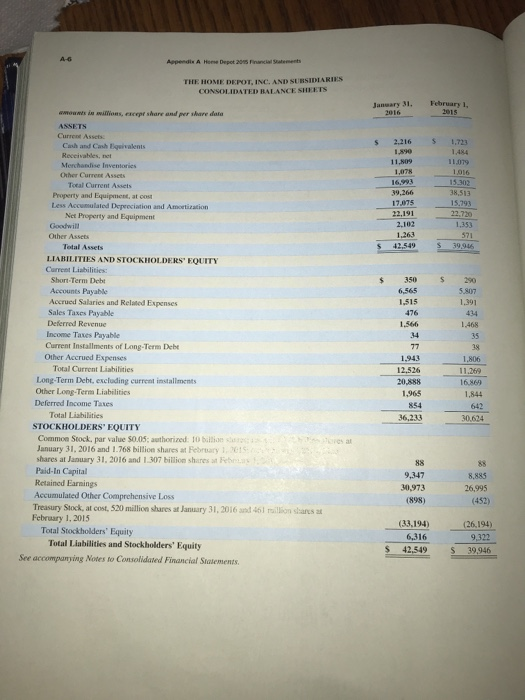
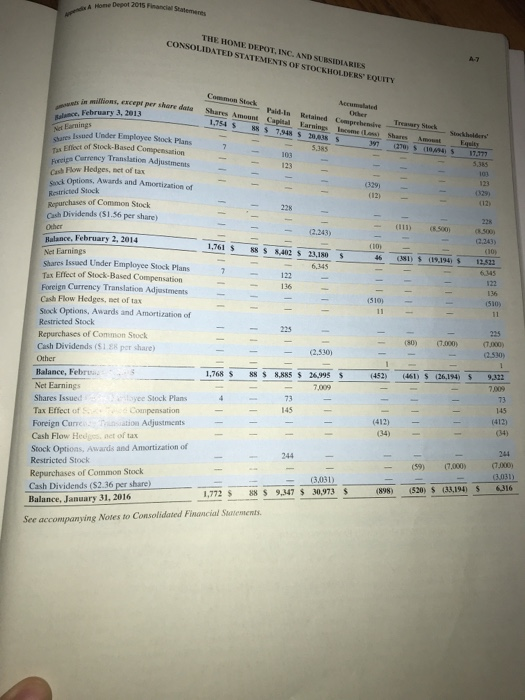
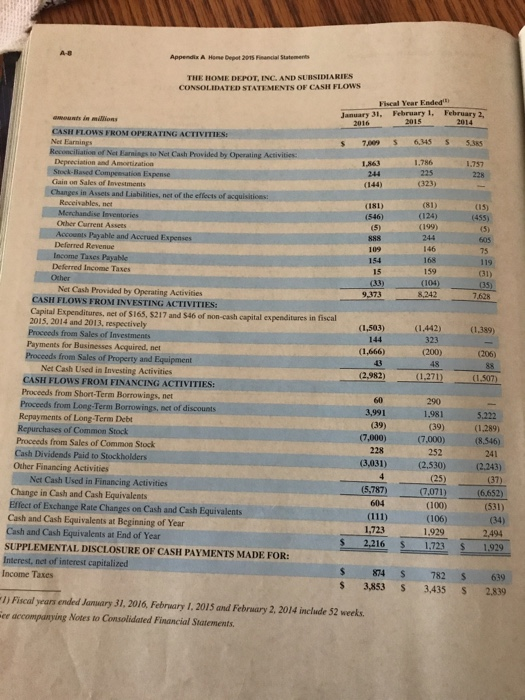
The Home Depot, Inc., financial statements appear in Appendix A at the end of this textbook. a. Identify where you can tell that the company uses straight-line depreciation. b. Which of the following statement is false? c. Using information from the consolidated financial statements, calculate the following for the year ended February 1, 2015: a) Net Income, b) Gross profit as a % of sales, c) Current ratio at February 1. 2015, d) Current ratio at the end of the previous year, and e) Net cash flows from operating activities. Complete this question by entering your answers in the tabs below. Required A Required B Required C Using information from the consolidated financial statements, calculate the following for the year ended February 1, 2015: a) Net income, b) Gross profit as a % of sales, c) Current ratio at February 1, 2015, d) Current ratio at the end of the previous year, and e) Net cash flows from operating activities. (Round all dollar amounts and ratios to 2 decimal places. Round percentages to the nearest whole number.) Not income million Gross profit as a percentage of sales Current ratio at January 31, 2016 Current ratio at February 1, 2015 Net cash flows from operating activities million Required B A-4 Appendix A Home Depot 2015 Financial Statements THE HOME DEPOT. INC. AND SUBSIDIARIES CONSOLIDATED STATEMENTS OF EARNINGS Fiscal Year Endedh February 1, 2015 January 31, 2016 88.519 February 2, 2014 amounts in millions, except per share data NET SALES 83.176 S 78,812 51.897 26.915 Cost of Sales GROSS PROFIT Operating Expenses: Selling, General and Administratives Depreciation and Amortization Total Operating Expenses OPERATING INCOME Interest and Other (Income) Expense: 54,787 58,254 28,389 30.265 16.280 16,801 16,122 1,640 1.627 1,690 17.920 17,749 18.491 10,469 11,774 9.166 Interest and Ievestment Income Interest Expense Interest and Other, net EARNINGS BEFORE PROVISION FOR INCOME TAXES (337) (166) (12) 711 699 830 919 493 753 9,976 11.021 8,467 Provision for Income Taxes NET EARNINGS 3,631 4,012 3,082 6,345 7,009 S 5.385 Weighted Average Common Shares BASIC EARNINGS PER SHARE 1,338 1,277 1,425 4.74 5.49 S 3.78 Diluted Weighted Average Common Shares 1,283 1,346 1,434 DILUTED EARNINGS PER SHARE S 5.46 4.71 S 3.76 (I) Fiscal years ended January 31, 2016, February 1, 2015 and February 2, 2014 include 52 weeks See accompanying Notes to Consolidated Financial Statements Appendix A Home Depot 2015 Financial Statements THE HOME DEPOT, INC. AND SUBSIDIARIES CONSOLIDATED STATEMENTS OF COMPREHENSIVE INCOME Fiscal Year Ended January 31, 2016 mounts in millions February 1, February 2, 2014 Net Earnings Ouher Comprehensive Loss: Foreign Currency Translation Adjustments Cash Flow Hedges, net of tax 2015 7009 6.345 S 5,385 (412) (510) (329) (34) 11 (12) Other Total Other Comprehensive Loss 1 (10) (446) (498) (351) COMPREHENSIVE INCOME 6,563 5,847 S 5,034 (lFiscal years ended January 31, 2016, February 1, 2015 and February 2, 2014 include 52 weeks See accompanying Notes to Consolidated Financial Statements A-6 Appendix A Honse Depot 205 Financial Statements THE HOME DEPOT, INC, AND SUBSIDIARIES CONSOLIDATED BALANCE SHEETS January 31, 2016 February 1, 2015 amounts in swilions, except share and per share data ASSETS Currene Assets 2,216 1,723 Cash and Cash Equivalents 1,890 11.809 1078 1,484 Receivables, net Merchandise Inventories 11.079 1,016 Other CurresE Assets 16.993 15.302 Toeal Current Assets. 38.513 39.266 Property and Equipment, at cost Less Accumulated Depeeciation and Amortization 17.075 15,793 22.720 22,191 Net Property and Equipment 2,102 1.263 1.353 Goodwill 571 Other Assets 42.549 39,946 Total Assets LIABILITIES AND STOCKHOLDERS EQUITY Carrent Liabilities Short-Term Debt Accounts Payable Accrued Salaries and Related Expenses S 350 290 6,565 5,807 1.515 1,391 Sales Taxes Payable 476 434 Deferred Revenue 1,566 1,468 Income Taxes Payable 34 35 Current Installments of Long-Term Debt Other Accrued Expenses Total Current Liabilities Long-Term Debt, excluding current installments Other Long Term Liabilities 77 38 1,943 1,806 11.269 12,526 20.888 16.869 1,965 1.844 Deferred Income Taxes 854 642 Total Liabilities 36,233 30,624 STOCKHOLDERS' EQUITY Common Stock, par value $0.05; authorized: 10 billion s January 31, 2016 and 1.768 billion shares at February 1, 2015 shares at January 31, 2016 and 1.307 billion shares at Febeas Paid-In Capital Retained Earnings Accumulated Other Comprehensive Loss Treasury Stock, at cost, 520 million shares at January 31, 2016 and 461 rilion shares at February 1, 2015 Total Stockholders' Equity es at 88 88 9,347 8,885 30,973 26,995 (898) (452) (33,194) (26,194) 6,316 9,322 Total Liabilities and Stockholders' Equity 42.549 S 39.946 See accompanying Notes to Consolidated Financial Statements d A Hone Depot 2015 Financial Statemerts THE HOME DEPOT. INC. AND SUBSIDIARIES CONSOLIDATED STATEMENTS OF STOCKHOLDERS EQUITY A-7 Common Steck Aecumlated at in millions, except per share datg Paid-In. Shares Amount Odher Retained Comprehensive Capital 8 S Treasary Stock Balence, February 3, 2013 1.754 S Earaings Income (Loss) Shares Stockholders Net Earnings Shares Issued Under Employee Stock Plans Effect of Stock-Based Compensation Freigs Carrency Translation Adjustments Csh Flow Hedges, net of tax Oetions, Awards and Amortization of 1348 S 20.838 S Amonat Eqsity 17,777 97 7 5.385 103 5,385 123 103 123 (329 029) (12) Restricted Stock Repurchases of Common Stock Csh Dividends (S1.56 per share) (12) 228 228 (11) (8.500) (2.243) Other (2.243) Balance, February 2, 2014 (10 1.761 $ (10) s8 S S402 S 23,180 (381) (19.194 $ A6 Net Earnings Shares Issued Under Employee Stock Plans Tas Effect of Stock-Based Compensation Foreign Currency Translation Adjustments 12.522 6345 6.345 122 122 136 136 (510) (510) Cash Flow Hedges, net of tax Stock Options, Awards and Amortization of Restricted Stock Repurchases of Common Stock Cash Dividends (S1 28 per share 11 11 274 225 (7000) (2.530h (7000) (80) (2.5301 Other (461) S (26,194) 9.322 (452) 88 $ 8.885 S 26.995 S Balance, Febr Net Earnings 1,768 S 7,009 7,009 73 73 ayee Stock Plans Shares Issued 145 145 Tax Effect of S Compensation Foreign Curres Trnsiation Adjustments Cash Flow Hedges, aet of tax Stock Optioas, Awards and Amortization of (412) (412) (34) (34) 244 244 (7000) (7,000) (59) Restricted Stock (3.031) Repurchases of Common Stock Cash Dividends ($2.36 per share) (3,031) 6316 (520) $ (33.194) $. (898) 9,347 30.973 1772 S Balance, January 31, 2016 See accompanying Notes to Consolidated Financial Statements HO IIII AB Appendix A Hone Depot 2015 Financial Statements THE HOME DEPOT, INC. AND SUBSIDIARIES CONSOLIDATED STATEMENTS OF CASH FLOWS Fiscal Year Ended February 1, February 2, January 31 amounts in millions 2015 2014 2016 CASH FLOWS FROM OPERATING ACTIVITIES Net Earnings Reconciliation of Net Earnings to Net Cash Provided by Operating Activities: Depreciation and Amoetization Stock-Based Compensation Expense Gain on Sales of Investments 6,345 7909 5.385 1,786 1.863 1,757 225 244 228 (323) (144) Changes in Assets and Liabilities, net of the effects of acquisitions: Receivables, net Merchandise Inventories Other Current Assets (81) (181) (15) (124) (546) (455) (5) (199) (5) Accounts Payable and Accrued Expenses Deferred Revenue 888 244 605 146 109 75 Income Tases Payable Deferred Income Taxes 168 154 119 159 15 (31) (35) 7,628 Other (33) (104) Net Cash Provided by Operating Activities CASH FLOWS FROM INVESTING ACTIVITIES: 9.373 8.242 Capital Expenditures, net of S165, $217 and $46 of non-cash capital expenditares in fiscal 2015, 2014 and 2013, respectively (1,503) (1,442) (1,389) Proceeds from Sales of Investments. 144 323 Payments for Businesses Acquired, net Proceeds from Sales of Property and Equipment (1,666) (200) (206) 43 45 88 Net Cash Used in Investing Activities CASH FLOWS FROM FINANCING ACTIVITIES: Proceeds from Short-Term Borrowings, net Proceeds from Long-Term Borrowings, net of discounts (2,982) (1,271) (1,507) 60 290 3,991 1,981 5.222 Repayments of Long-Term Debt Repurchases of Common Stock Proceeds from Sales of Common Stock Cash Dividends Paid to Stockholders (39) (39) (1,289) (7,000) (7,000) 252 (8,546) 241 228 (3,031) (2,530) Other Financing Activities Net Cash Used in Financing Activities Change in Cash and Cash Equivalents Effect of Exchange Rate Changes on Cash and Cash Equivalents Cash and Cash Equivalents at Beginning of Year Cash and Cash Equivalents at End of Year (2,243) 4 (25) (37) (5,787) (7,071) (6,652) 604 (100) (531) (111) (106) (34) 1,723 1,929 2,494 2,216 S SUPPLEMENTAL DISCLOSURE OF CASH PAYMENTS MADE FOR: 1,723 1,929 Interest, net of interest capitalized Income Taxes 874 782 S 639 3,853 3,435 S 2,839 ) Fiscal years ended January 31, 2016, February I, 2015 and February 2, 2014 include 52 weeks Gee accompanying Notes to Consolidated Financial Statements