

The hydrochemistry data for HH2 are given in Table 2 (a sample from the ocean close...
Fantastic news! We've Found the answer you've been seeking!
Question:
Transcribed Image Text:
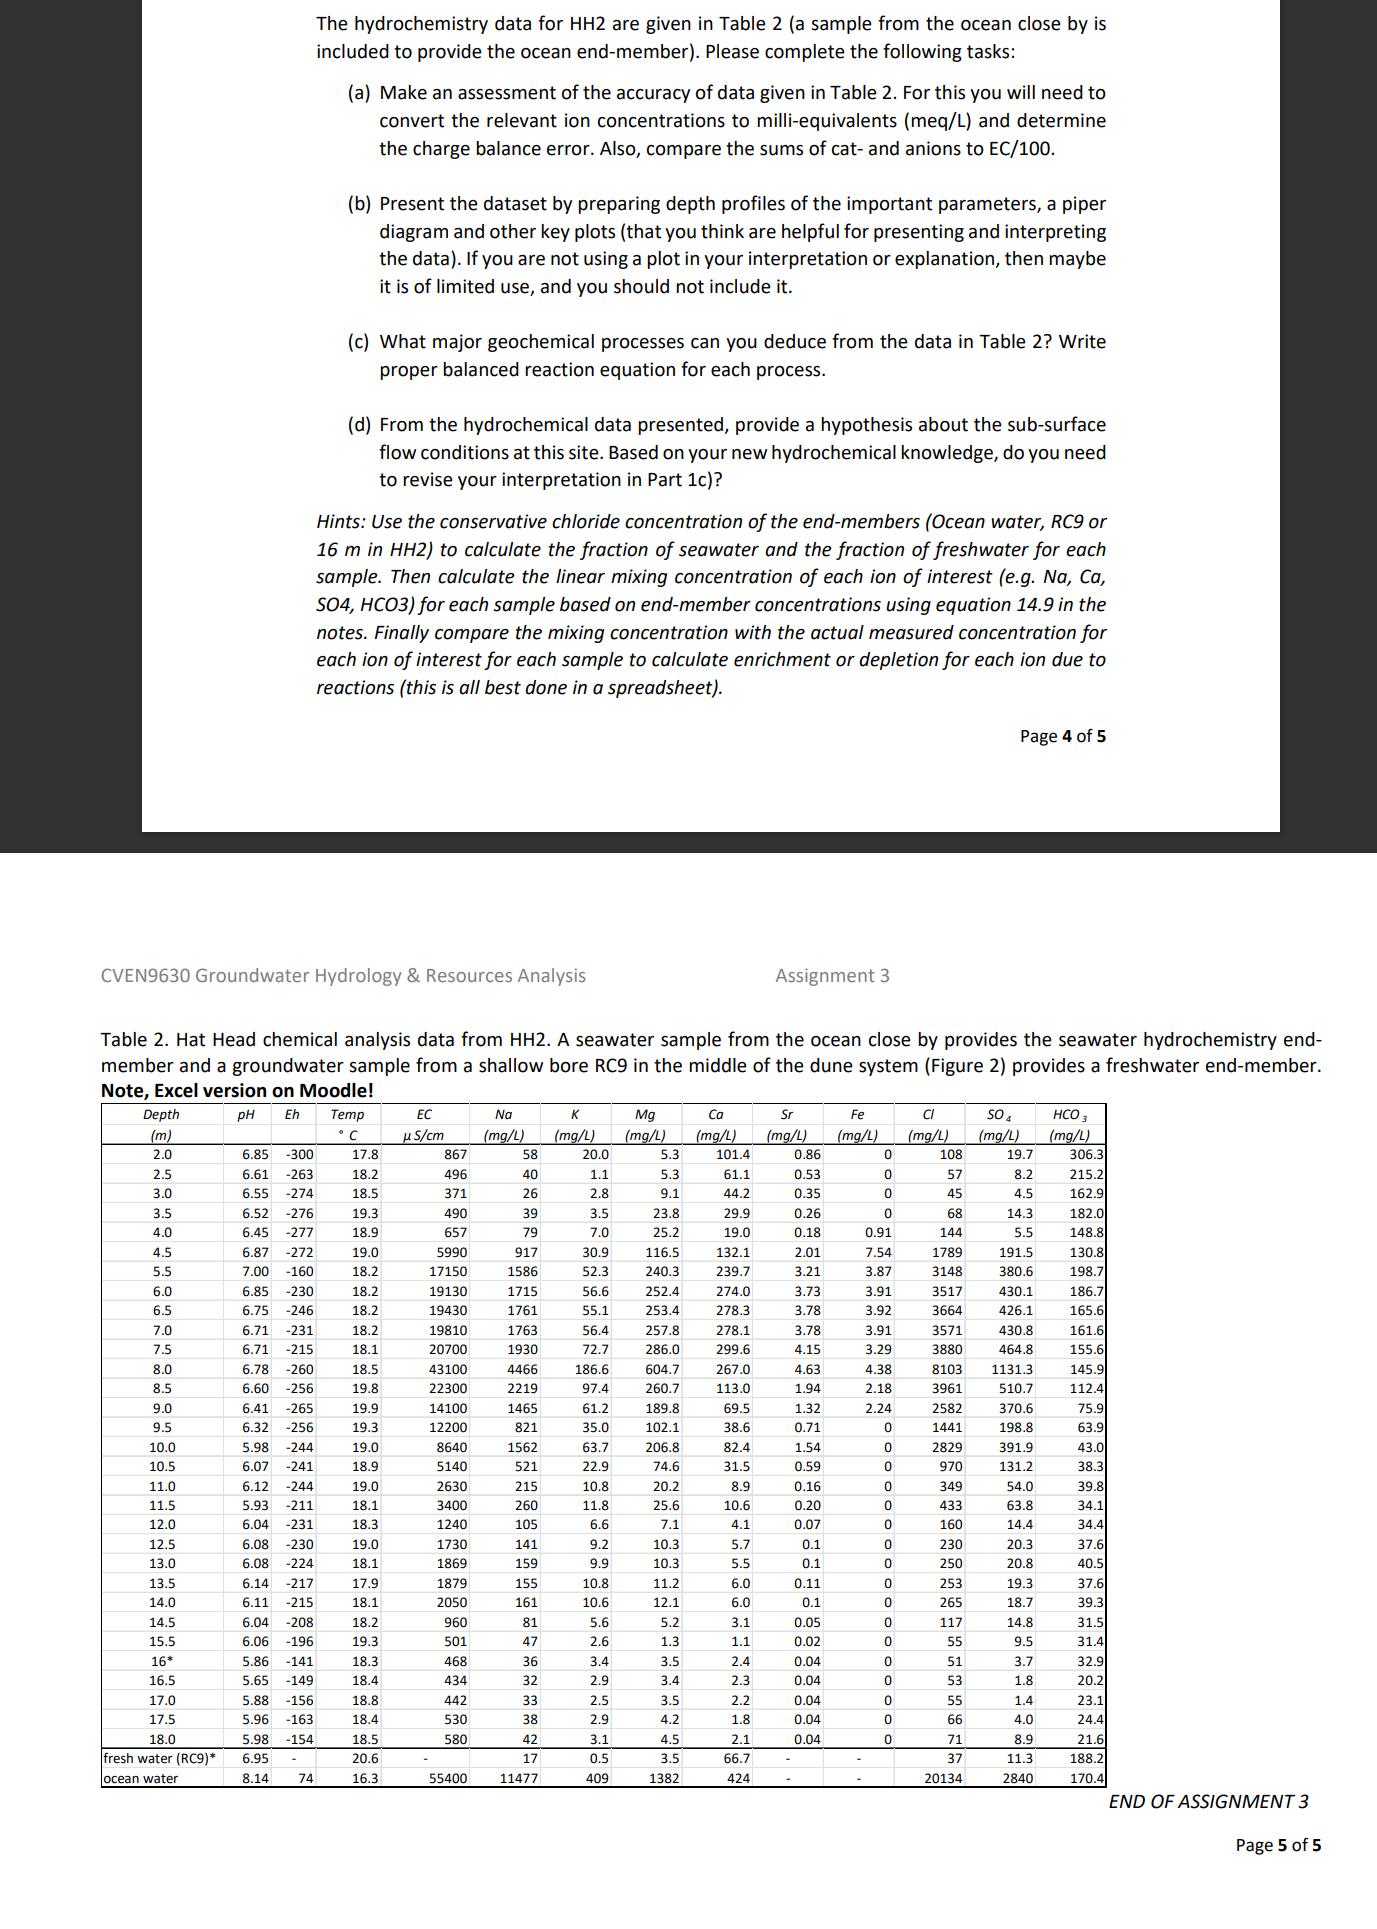
The hydrochemistry data for HH2 are given in Table 2 (a sample from the ocean close by is included to provide the ocean end-member). Please complete the following tasks: (a) Make an assessment of the accuracy of data given in Table 2. For this you will need to convert the relevant ion concentrations to milli-equivalents (meq/L) and determine the charge balance error. Also, compare the sums of cat- and anions to EC/100. (b) Present the dataset by preparing depth profiles of the important parameters, a piper diagram and other key plots (that you think are helpful for presenting and interpreting the data). If you are not using a plot in your interpretation or explanation, then maybe it is of limited use, and you should not include it. (c) What major geochemical processes can you deduce from the data in Table 2? Write proper balanced reaction equation for each process. (d) From the hydrochemical data presented, provide a hypothesis about the sub-surface flow conditions at this site. Based on your new hydrochemical knowledge, do you need to revise your interpretation in Part 1c)? Hints: Use the conservative chloride concentration of the end-members (Ocean water, RC9 or 16 m in HH2) to calculate the fraction of seawater and the fraction of freshwater for each sample. Then calculate the linear mixing concentration of each ion of interest (e.g. Na, Ca, SO4, HCO3) for each sample based on end-member concentrations using equation 14.9 in the notes. Finally compare the mixing concentration with the actual measured concentration for each ion of interest for each sample to calculate enrichment or depletion for each ion due to reactions (this is all best done in a spreadsheet). Page 4 of 5 CVEN9630 Groundwater Hydrology & Resources Analysis Assignment 3 Table 2. Hat Head chemical analysis data from HH2. A seawater sample from the ocean close by provides the seawater hydrochemistry end- member and a groundwater sample from a shallow bore RC9 in the middle of the dune system (Figure 2) provides a freshwater end-member. Note, Excel version on Moodle! Depth pH Eh (m) Temp C EC S/cm K Mg Ca Sr Fe Cl (mg/L) (mg/L) (mg/L) (mg/L) (mg/L) (mg/L) SO4 (mg/L) (mg/L) HCO 3 (mg/L) 2.0 6.85 -300 17.8 867 58 20.0 5.3 101.4 0.86 0 108 19.7 306.3 2.5 6.61 -263 18.2 496 40 1.1 5.3 61.1 0.53 0 57 8.2 215.2 3.0 6.55 -274 18.5 371 26 2.8 9.1 44.2 0.35 0 45 4.5 162.9 3.5 6.52 -276 19.3 490 39 3.5 23.8 29.9 0.26 0 68 14.3 182.0 4.0 6.45 -277 18.9 657 79 7.0 25.2 19.0 0.18 0.91 144 5.5 148.8 4.5 6.87 -272 19.0 5990 917 30.9 116.5 132.1 2.01 7.54 1789 191.5 130.8 5.5 7.00 -160 18.2 17150 1586 52.3 240.3 239.7 3.21 3.87 3148 380.6 198.7 6.0 6.85 -230 18.2 19130 1715 56.6 252.4 274.0 3.73 3.91 3517 430.1 186.7 6.5 6.75 -246 18.2 19430 1761 55.1 253.4 278.3 3.78 3.92 3664 426.1 165.6 7.0 6.71 -231 18.2 19810 1763 56.4 257.8 278.1 3.78 3.91 3571 430.8 161.6 7.5 6.71 -215 18.1 20700 1930 72.7 286.0 299.6 4.15 3.29 3880 464.8 155.6 8.0 6.78 -260 18.5 43100 4466 186.6 604.7 267.0 4.63 4.38 8103 1131.3 145.9 8.5 6.60 -256 19.8 22300 2219 97.4 260.7 113.0 1.94 2.18 3961 510.7 112.4 9.0 6.41 -265 19.9 14100 1465 61.2 189.8 69.5 1.32 2.24 2582 370.6 75.9 9.5 6.32 -256 19.3 12200 821 35.0 102.1 38.6 0.71 0 1441 198.8 63.9 10.0 5.98 -244 19.0 8640 1562 63.7 206.8 82.4 1.54 0 2829 391.9 43.0 10.5 6.07 -241 18.9 5140 521 22.9 74.6 31.5 0.59 0 970 131.2 38.3 11.0 6.12 -244 19.0 2630 215 10.8 20.2 8.9 0.16 0 349 54.0 39.8 11.5 5.93 -211 18.1 3400 260 11.8 25.6 10.6 0.20 0 433 63.8 34.1 12.0 6.04 -231 18.3 1240 105 6.6 7.1 4.1 0.07 0 160 14.4 34.4 12.5 6.08. -230 19.0 1730 141 9.2 10.3 5.7 0.1 0 230 20.3 37.6 13.0 6.08 -224 18.1 1869 159 9.9 10.3 5.5 0.1 0 250 20.8 40.5 13.5 6.14 -217 17.9 1879 155 10.8 11.2 6.0 0.11 0 253 19.3 37.6 14.0 6.11 -215 18.1 2050 161 10.6 12.1 6.0 0.1 0 265 18.7 39.3 14.5 6.04 -208 18.2 960 81 5.6 5.2 3.1 0.05 0 117 14.8 31.5 15.5 6.06 -196 19.3 501 47 2.6 1.3 1.1 0.02 0 55 9.5 31.4 16* 5.86 -141 18.3 468 36 3.4 3.5 2.4 0.04 0 51 3.7 32.9 16.5 5.65 -149 18.4 434 32 2.9 3.4 2.3 0.04 0 53 1.8 20.2 17.0 5.88 -156 18.8 442 33 2.5 3.5 2.2 0.04 0 55 1.4. 23.1 17.5 5.96 -163 18.4 530 38 2.9 4.2 1.8 0.04 0 66 4.0 24.4 18.0 5.98 -154 18.5 580 42 3.1 4.5 2.1 0.04 0 71 8.9 21.6 fresh water (RC9)* 6.95 20.6 17 0.5 3.5 66.7 37 11.3 188.2 ocean water 8.14 74 16.3 55400 11477 409 1382 424 20134 2840 170.4 END OF ASSIGNMENT 3 Page 5 of 5 The hydrochemistry data for HH2 are given in Table 2 (a sample from the ocean close by is included to provide the ocean end-member). Please complete the following tasks: (a) Make an assessment of the accuracy of data given in Table 2. For this you will need to convert the relevant ion concentrations to milli-equivalents (meq/L) and determine the charge balance error. Also, compare the sums of cat- and anions to EC/100. (b) Present the dataset by preparing depth profiles of the important parameters, a piper diagram and other key plots (that you think are helpful for presenting and interpreting the data). If you are not using a plot in your interpretation or explanation, then maybe it is of limited use, and you should not include it. (c) What major geochemical processes can you deduce from the data in Table 2? Write proper balanced reaction equation for each process. (d) From the hydrochemical data presented, provide a hypothesis about the sub-surface flow conditions at this site. Based on your new hydrochemical knowledge, do you need to revise your interpretation in Part 1c)? Hints: Use the conservative chloride concentration of the end-members (Ocean water, RC9 or 16 m in HH2) to calculate the fraction of seawater and the fraction of freshwater for each sample. Then calculate the linear mixing concentration of each ion of interest (e.g. Na, Ca, SO4, HCO3) for each sample based on end-member concentrations using equation 14.9 in the notes. Finally compare the mixing concentration with the actual measured concentration for each ion of interest for each sample to calculate enrichment or depletion for each ion due to reactions (this is all best done in a spreadsheet). Page 4 of 5 CVEN9630 Groundwater Hydrology & Resources Analysis Assignment 3 Table 2. Hat Head chemical analysis data from HH2. A seawater sample from the ocean close by provides the seawater hydrochemistry end- member and a groundwater sample from a shallow bore RC9 in the middle of the dune system (Figure 2) provides a freshwater end-member. Note, Excel version on Moodle! Depth pH Eh (m) Temp C EC S/cm K Mg Ca Sr Fe Cl (mg/L) (mg/L) (mg/L) (mg/L) (mg/L) (mg/L) SO4 (mg/L) (mg/L) HCO 3 (mg/L) 2.0 6.85 -300 17.8 867 58 20.0 5.3 101.4 0.86 0 108 19.7 306.3 2.5 6.61 -263 18.2 496 40 1.1 5.3 61.1 0.53 0 57 8.2 215.2 3.0 6.55 -274 18.5 371 26 2.8 9.1 44.2 0.35 0 45 4.5 162.9 3.5 6.52 -276 19.3 490 39 3.5 23.8 29.9 0.26 0 68 14.3 182.0 4.0 6.45 -277 18.9 657 79 7.0 25.2 19.0 0.18 0.91 144 5.5 148.8 4.5 6.87 -272 19.0 5990 917 30.9 116.5 132.1 2.01 7.54 1789 191.5 130.8 5.5 7.00 -160 18.2 17150 1586 52.3 240.3 239.7 3.21 3.87 3148 380.6 198.7 6.0 6.85 -230 18.2 19130 1715 56.6 252.4 274.0 3.73 3.91 3517 430.1 186.7 6.5 6.75 -246 18.2 19430 1761 55.1 253.4 278.3 3.78 3.92 3664 426.1 165.6 7.0 6.71 -231 18.2 19810 1763 56.4 257.8 278.1 3.78 3.91 3571 430.8 161.6 7.5 6.71 -215 18.1 20700 1930 72.7 286.0 299.6 4.15 3.29 3880 464.8 155.6 8.0 6.78 -260 18.5 43100 4466 186.6 604.7 267.0 4.63 4.38 8103 1131.3 145.9 8.5 6.60 -256 19.8 22300 2219 97.4 260.7 113.0 1.94 2.18 3961 510.7 112.4 9.0 6.41 -265 19.9 14100 1465 61.2 189.8 69.5 1.32 2.24 2582 370.6 75.9 9.5 6.32 -256 19.3 12200 821 35.0 102.1 38.6 0.71 0 1441 198.8 63.9 10.0 5.98 -244 19.0 8640 1562 63.7 206.8 82.4 1.54 0 2829 391.9 43.0 10.5 6.07 -241 18.9 5140 521 22.9 74.6 31.5 0.59 0 970 131.2 38.3 11.0 6.12 -244 19.0 2630 215 10.8 20.2 8.9 0.16 0 349 54.0 39.8 11.5 5.93 -211 18.1 3400 260 11.8 25.6 10.6 0.20 0 433 63.8 34.1 12.0 6.04 -231 18.3 1240 105 6.6 7.1 4.1 0.07 0 160 14.4 34.4 12.5 6.08. -230 19.0 1730 141 9.2 10.3 5.7 0.1 0 230 20.3 37.6 13.0 6.08 -224 18.1 1869 159 9.9 10.3 5.5 0.1 0 250 20.8 40.5 13.5 6.14 -217 17.9 1879 155 10.8 11.2 6.0 0.11 0 253 19.3 37.6 14.0 6.11 -215 18.1 2050 161 10.6 12.1 6.0 0.1 0 265 18.7 39.3 14.5 6.04 -208 18.2 960 81 5.6 5.2 3.1 0.05 0 117 14.8 31.5 15.5 6.06 -196 19.3 501 47 2.6 1.3 1.1 0.02 0 55 9.5 31.4 16* 5.86 -141 18.3 468 36 3.4 3.5 2.4 0.04 0 51 3.7 32.9 16.5 5.65 -149 18.4 434 32 2.9 3.4 2.3 0.04 0 53 1.8 20.2 17.0 5.88 -156 18.8 442 33 2.5 3.5 2.2 0.04 0 55 1.4. 23.1 17.5 5.96 -163 18.4 530 38 2.9 4.2 1.8 0.04 0 66 4.0 24.4 18.0 5.98 -154 18.5 580 42 3.1 4.5 2.1 0.04 0 71 8.9 21.6 fresh water (RC9)* 6.95 20.6 17 0.5 3.5 66.7 37 11.3 188.2 ocean water 8.14 74 16.3 55400 11477 409 1382 424 20134 2840 170.4 END OF ASSIGNMENT 3 Page 5 of 5
Expert Answer:

Related Book For 

Business Statistics In Practice
ISBN: 9780073401836
6th Edition
Authors: Bruce Bowerman, Richard O'Connell
Posted Date:
Students also viewed these chemical engineering questions
-
1.Explain how capital budgeting is related to the wealth -maximazation goal that should pursued by financial manager of a firm. 1(i) A project is expected to generate net cash flows of Tsh 100Million...
-
SA-TIED YOUNG SCHOLARS PROGRAMME Young Scholars This paper was produced as a part of the SA-TIED Young Scholars' programme. The programme is a part of SATIED's capacity building initiatives, designed...
-
Planning is one of the most important management functions in any business. A front office managers first step in planning should involve determine the departments goals. Planning also includes...
-
During FY 2017, the voters of Surprise County approved construction of a $21 million police facility and an $11 million fire station to accommodate the county's population growth. The construction...
-
Compute the z parameters of the circuit in Fig. 19.70. 41, I 52102 V. 20 V2
-
When Keith Williams receives the cost of quality report, he is amazed and says, 'Nivita, you're the accountant. Why didn't you tell me before this that our quality costs were this high?" Explain why...
-
Explain (a) depositor insurance, (b) lender of last resort, (c) systemically important financial institution.
-
Superior Brands, Inc., wishes to analyze the joint impact of its working capital investment and financing policies on shareholder return and risk. The company has $40 million in fixed assets. Also,...
-
Jenae's study ignored the fact that only some of her coffee choices had caffeine, even though her co - workers preferred caffeinated coffee. Therefore, Jenae decided to label one type of...
-
Two forces are applied at point B of beam AB. Determine the magnitude and direction of their resultant using the triangle rule. B 3kN 40 2 kN
-
Select a controversial topic related to diverse cultures and communities currently affecting K-12 education. Potential topics could include body image, citizenship status, plastic/cosmetic surgery...
-
At a company Christmas party Barney scares John and Holly by putting on a ski mask and telling them to give up their money. John, not realizing it was a prank hits Barney and knocks him out. Seeing...
-
Consider the following cases: A child informs you that she has been abused physically and/or sexually. An adult female informs you that they are being abused physically and emotionally by their...
-
Let's begin with an example of negligence that you could experience in normal, everyday life. Phillip is driving down Bard Street--a residential street with normally little traffic. The posted speed...
-
Explain the concept of dynamic pricing online and what it attempts to achieve. Dynamic pricing is currently used by Ticketmaster for many concert tickets (Taylor Swift, for example). Describe both...
-
You are having a home theatre room added to your house. The project should take 5 days and cost $1,500 a day to complete. After 3 days, the project is 30% complete and $5,000 has been spent. What is...
-
A bubble-point liquid feed is to be distilled as shown in Figure. Use the Edmister group method to estimate the mole-fraction compositions of the distillate and bottoms. Assume initial overhead and...
-
Bowen Corporation has the following shares outstanding: 15,000 shares of \(\$ 50\) par value, six percent preferred stock and 50,000 shares of \(\$ 5\) par value common stock. During its first three...
-
High Corporation has 60,000 shares of \(\$ 20\) par value common stock outstanding and retained earnings of \(\$ 800,000\). The company declares a 100 percent stock dividend. The market price at the...
-
Lester Corporation has 30,000 shares of \(\$ 1\) par value common stock outstanding. The company has \(\$ 250,000\) of retained earnings. At year-end, the company declares a cash dividend of \(\$...

Study smarter with the SolutionInn App