

Question
The inactivation of an enzyme in a product treated with HHP generated the information shown in the table by plotting log (A/Ao) versus time in
The inactivation of an enzyme in a product treated with HHP generated the information shown in the table by plotting log (A/Ao) versus time in minutes at different temperatures and pressures. Using the information shown determine:
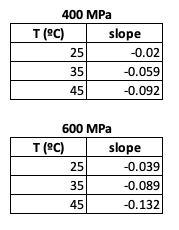
a) k, D, Va, Ea, ZP, ZT values b) Residual enzyme activity curve (A/Ao vs. time) at 400 MPa/30C to inactivate 90% of the enzyme.
400MPa \begin{tabular}{|l|r|} \hline \multicolumn{1}{|c|}{T () } & \multicolumn{1}{c|}{ slope } \\ \hline 25 & -0.02 \\ \hline 35 & -0.059 \\ \hline 45 & -0.092 \\ \hline \end{tabular} 600MPa \begin{tabular}{|l|r|} \hline \multicolumn{1}{|c|}{T(C)} & \multicolumn{1}{c|}{ slope } \\ \hline 25 & -0.039 \\ \hline 35 & -0.089 \\ \hline 45 & -0.132 \\ \hline \end{tabular}Step by Step Solution
There are 3 Steps involved in it
Step: 1

Get Instant Access to Expert-Tailored Solutions
See step-by-step solutions with expert insights and AI powered tools for academic success
Step: 2

Step: 3
Ace Your Homework with AI
Get the answers you need in no time with our AI-driven, step-by-step assistance
Get Started
Thermodynamics Concepts And Applications
Authors: Stephen R. Turns, Laura L. Pauley
2nd Edition
1107179718, 9781107179714