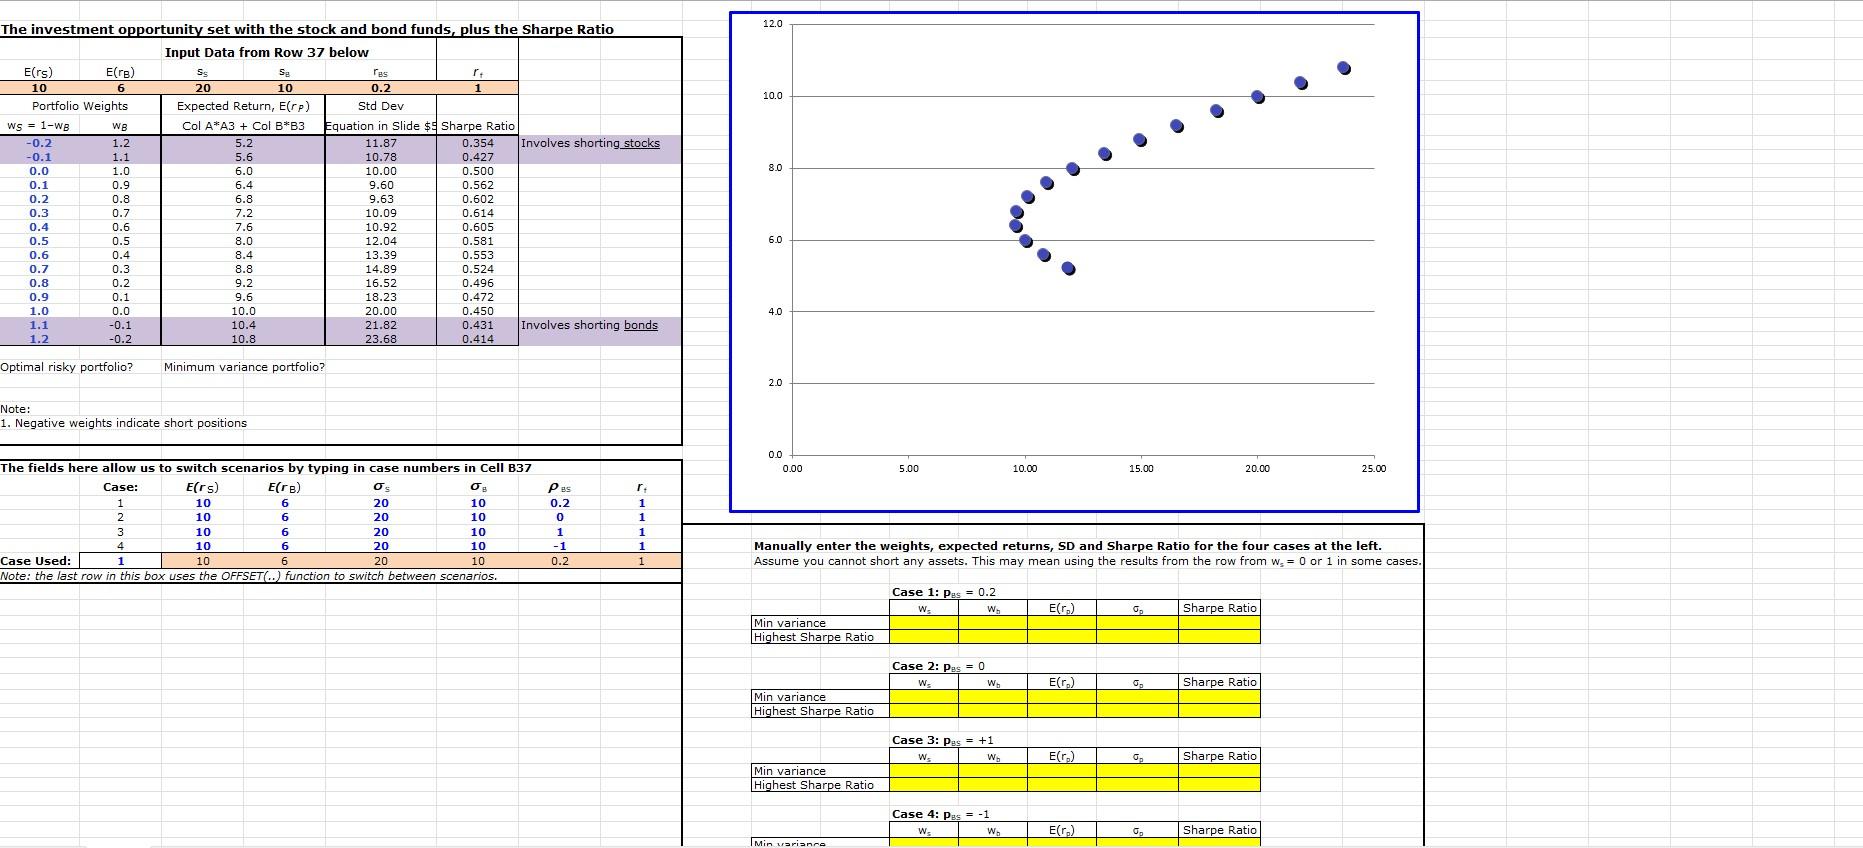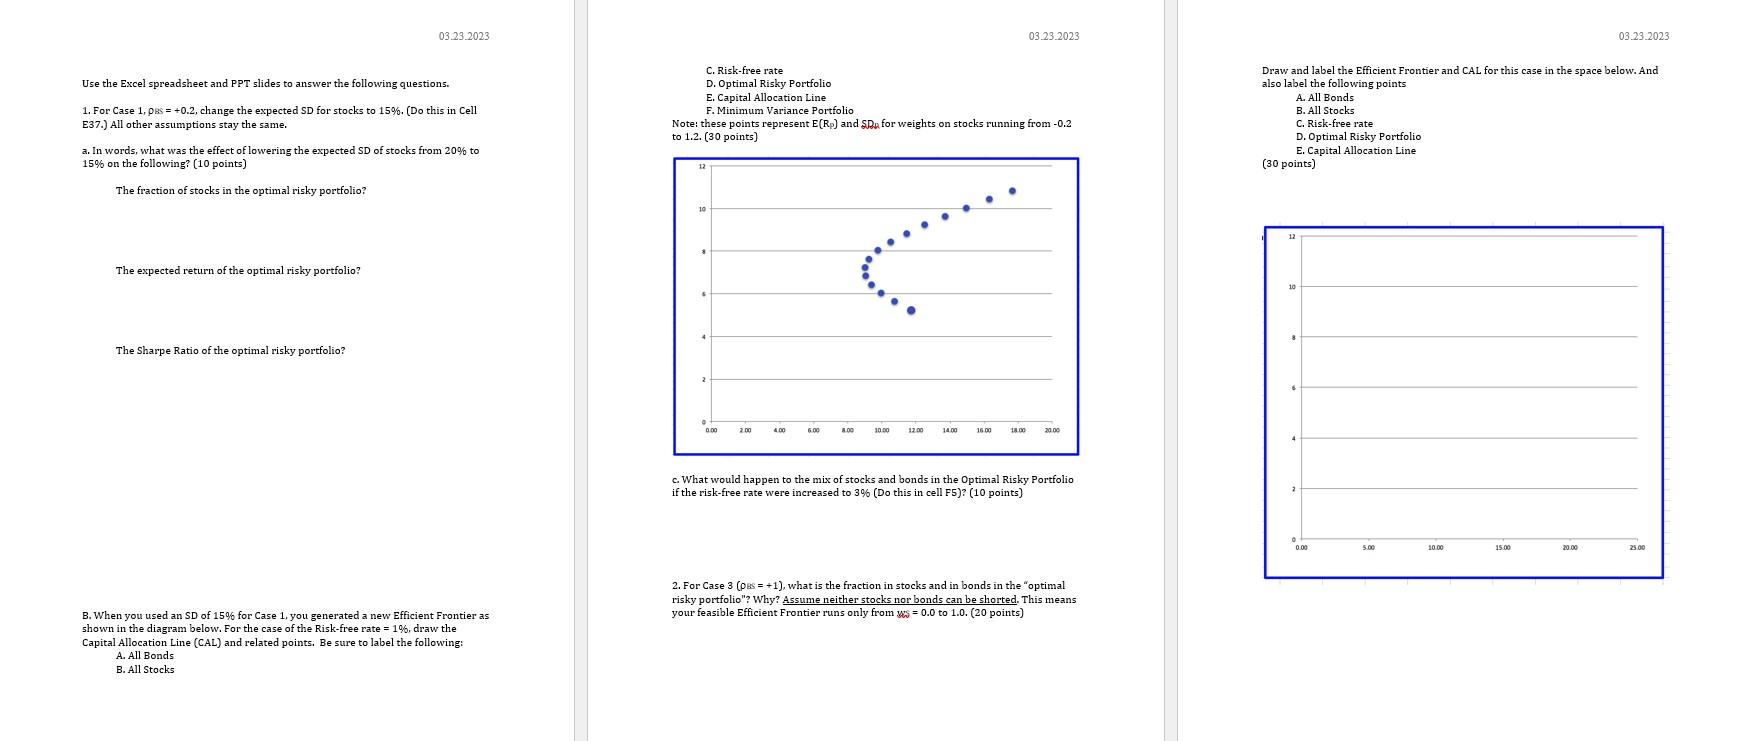

The investment opportunity set with the stock and bond funds, plus the Sharpe Ratio The fielde here allow uc tn cwitch crenarinc ho toninn in race numhere in Cell 837 Manually enter the weights, expected returns, SD and Sharpe Ratio for the four cases at the left. Assume you cannot short any assets. This may mean using the results from the row from ws=0 or 1 in some cas Draw and label the Efficient Frontier and CAL for this case in the space below. And c. What would happen to the mix of stocks and bonds in the Optimal Risky Portfolio if the risk-free rate were increased to 3% (Do this in cell F5)? (10 points) 2. For Case 3(ES=+1), what is the fraction in stocks and in bonds in the "optimal risky portfolio"? Why? Assume neither stocks nor bonds can be shorted. This means B. When you used an SD of 15% for Case 1, you generated a new Efficient Frontier as shown in the diagram below. For the case of the Risk-free rate =1%, draw the Capital Allocation Line (CAL) and related points. Be sure to label the following A. All Bonds B. All Stocks The investment opportunity set with the stock and bond funds, plus the Sharpe Ratio The fielde here allow uc tn cwitch crenarinc ho toninn in race numhere in Cell 837 Manually enter the weights, expected returns, SD and Sharpe Ratio for the four cases at the left. Assume you cannot short any assets. This may mean using the results from the row from ws=0 or 1 in some cas Draw and label the Efficient Frontier and CAL for this case in the space below. And c. What would happen to the mix of stocks and bonds in the Optimal Risky Portfolio if the risk-free rate were increased to 3% (Do this in cell F5)? (10 points) 2. For Case 3(ES=+1), what is the fraction in stocks and in bonds in the "optimal risky portfolio"? Why? Assume neither stocks nor bonds can be shorted. This means B. When you used an SD of 15% for Case 1, you generated a new Efficient Frontier as shown in the diagram below. For the case of the Risk-free rate =1%, draw the Capital Allocation Line (CAL) and related points. Be sure to label the following A. All Bonds B. All Stocks


