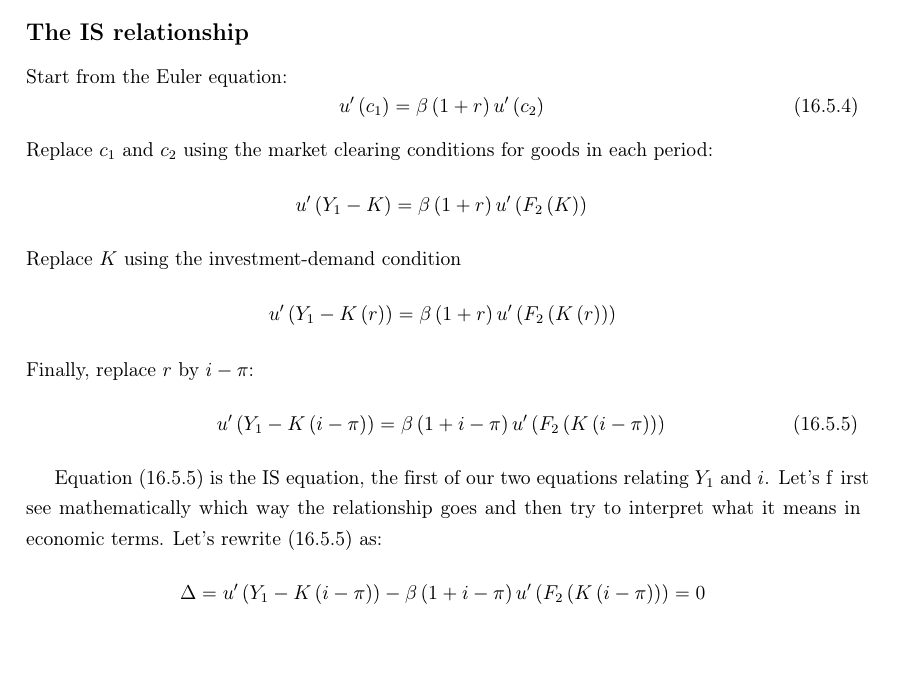
The IS relationship Start from the Euler equation: u' (c) = B(1+ r)u'(c2) (16.5.4) Replace ci and c2 using the market clearing conditions for goods
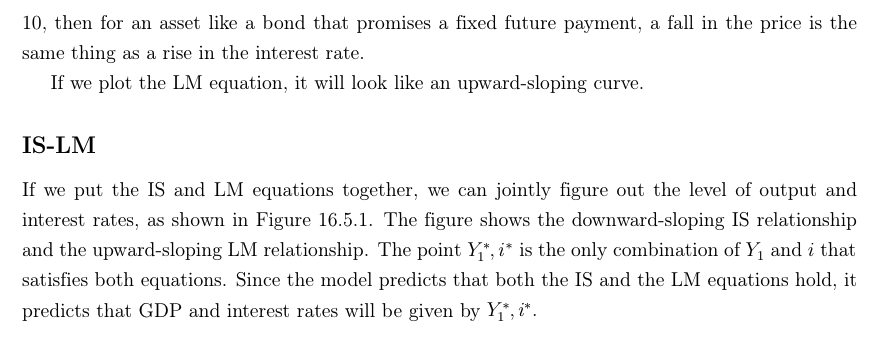
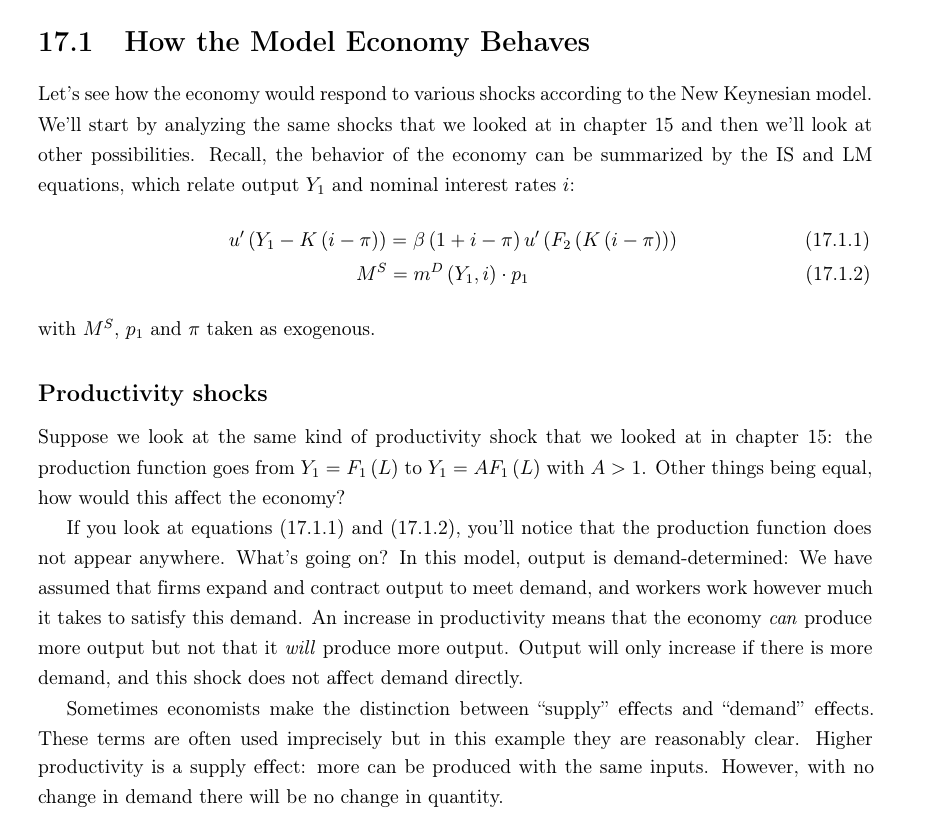
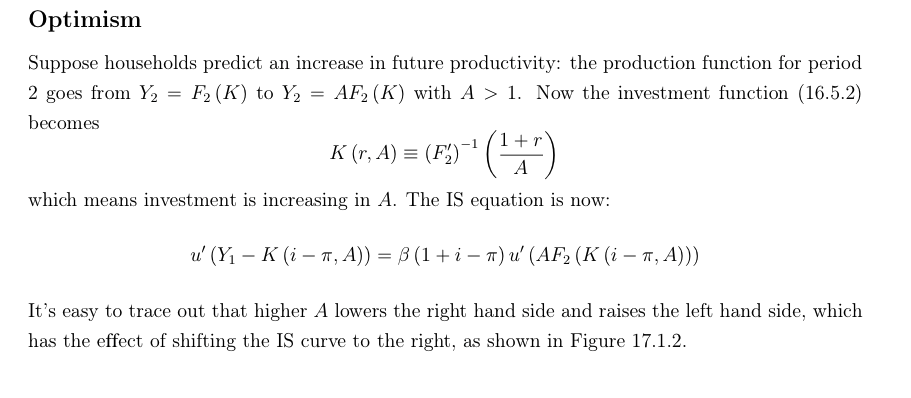
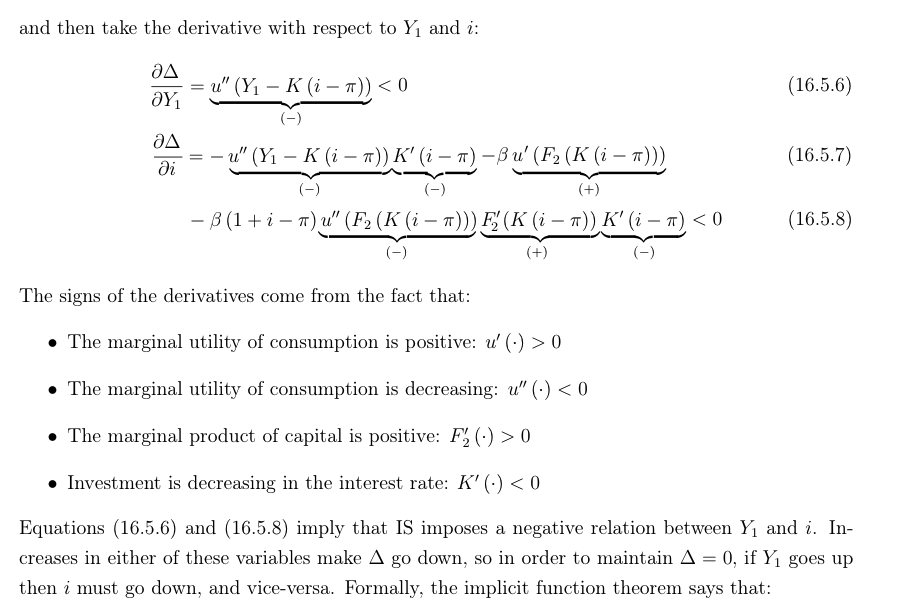
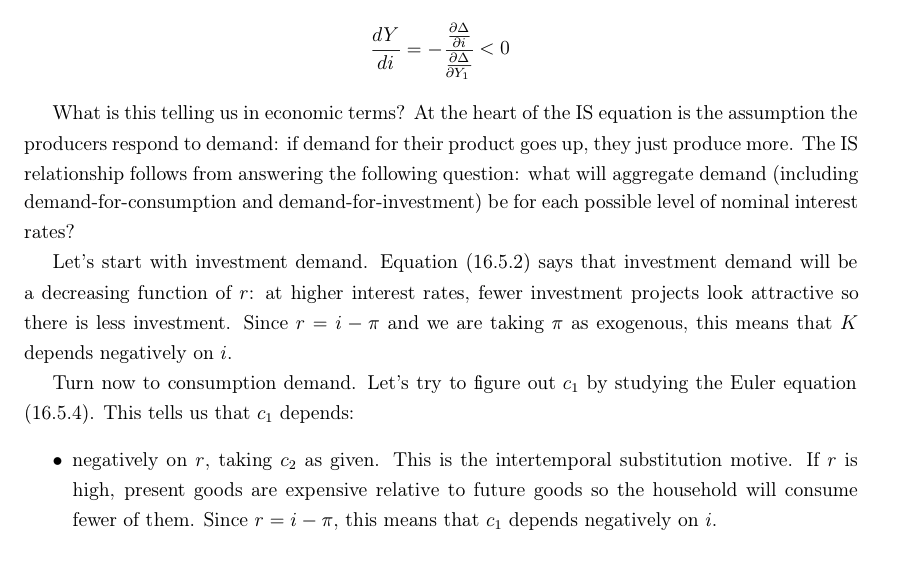
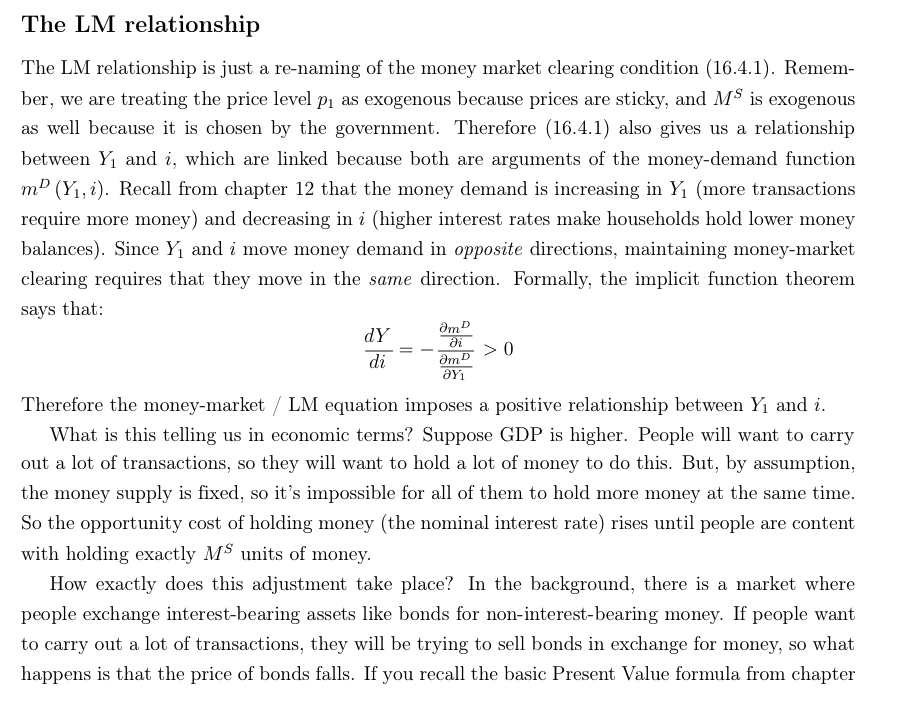
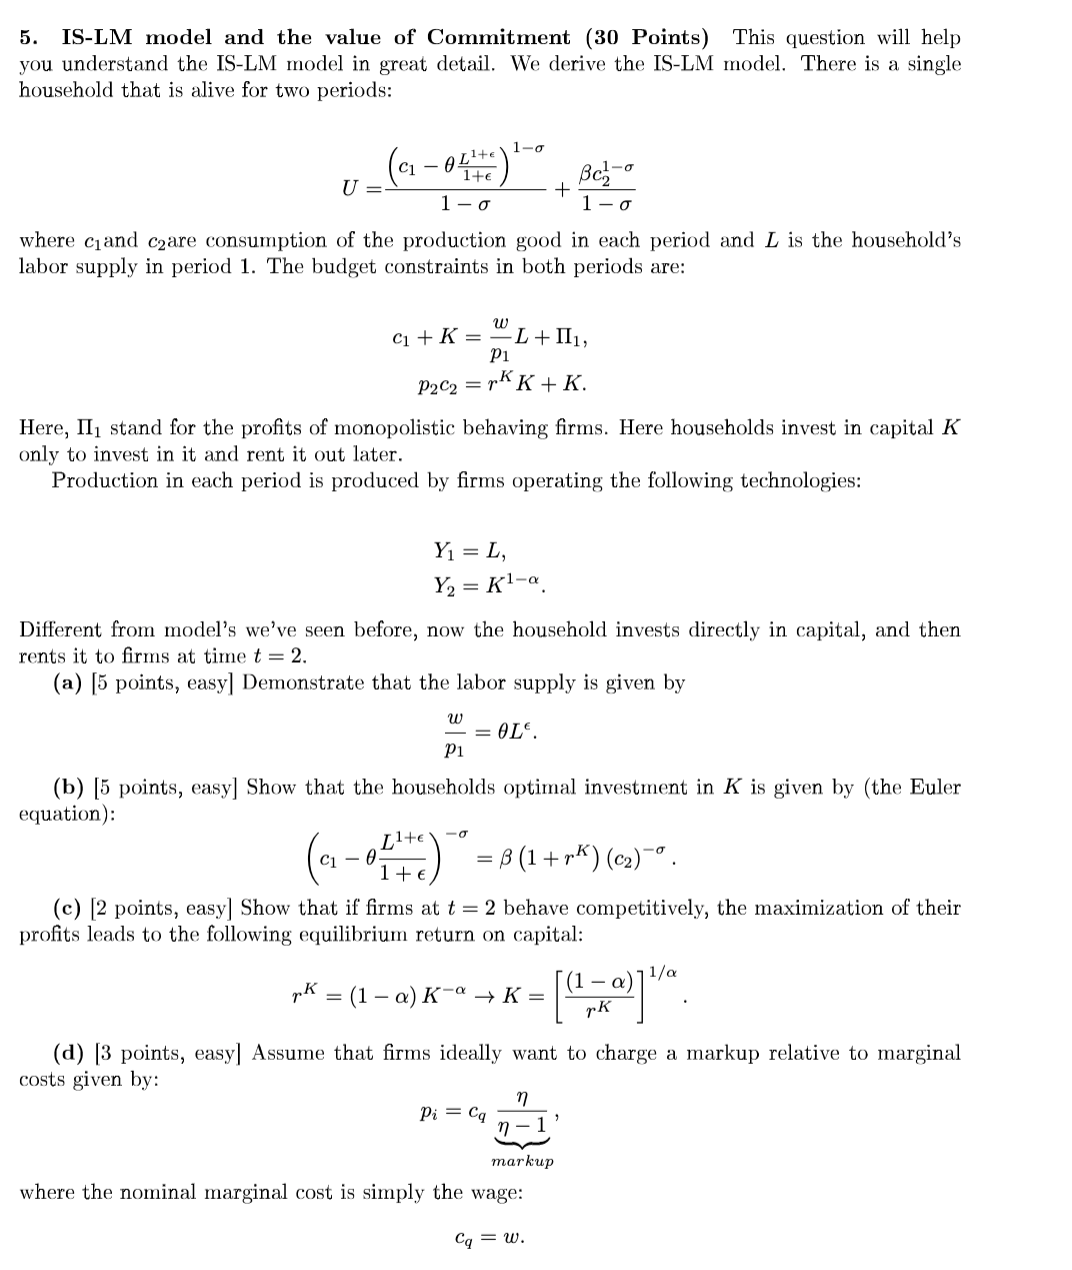
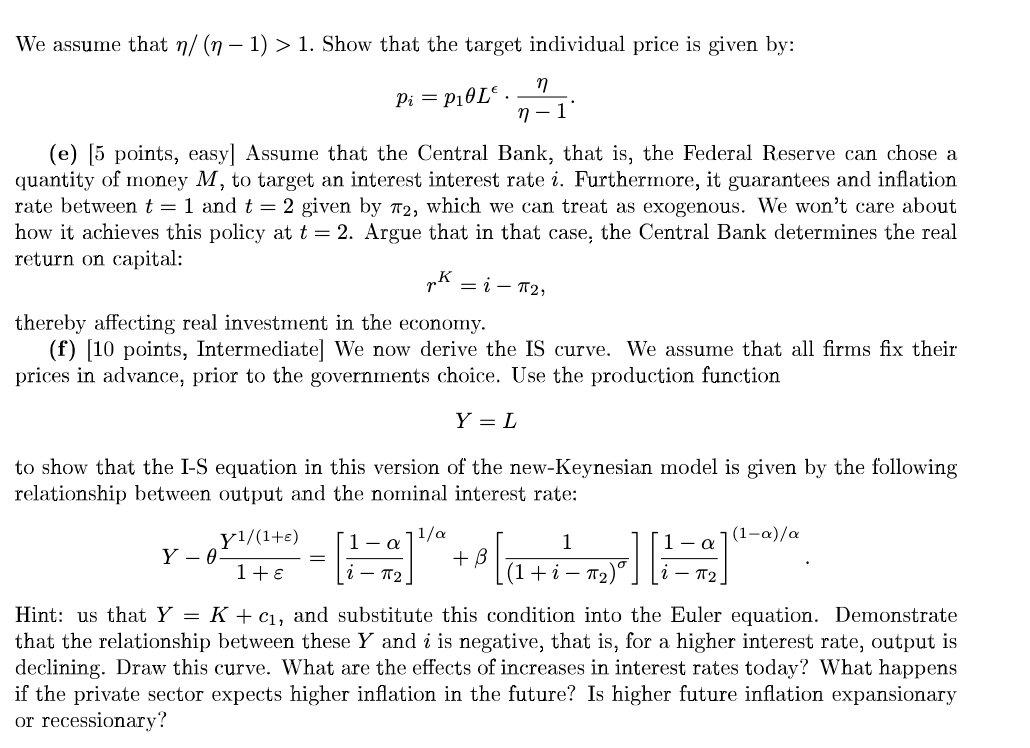
The IS relationship Start from the Euler equation: u' (c) = B(1+ r)u'(c2) (16.5.4) Replace ci and c2 using the market clearing conditions for goods in each period: u' (Y1 - K) = 3(1+ r)u' (F2 (K)) Replace K using the investment-demand condition u' (Y1 - K (r)) = 3(1+r)u' (F2 (K(r))) Finally, replacer by i - 7: u' (Y1 - K(i - 7)) = B(1+i -n)u'(F2(K(i -"))) (16.5.5) Equation (16.5.5) is the IS equation, the first of our two equations relating Y, and i. Let's first see mathematically which way the relationship goes and then try to interpret what it means in economic terms. Let's rewrite (16.5.5) as: A = u'(Y1 - K (i -7)) - B(1+i - q)u' (F2 (K(i -"))) =0and then take the derivative with respect to Y1 and 1': an H , (l BA . . .- - F = 11"{Yl K [1 7r))K' (1 1r) ;311 (F; [K [1 11')\" (16.5.7) 1 KV_J\\VJ \\-.v.-# {3 {l (H ,8 (1 +1 1r}:1\"{F2 (K (1 10)) PHI-i" [1' rr)) K" (1 _rrl D I The marginal utility of consumption is decreasing: 11\" {-) -=;' D I The marginal product of capital is positive: F; {-) 2: D I Investment is decreasing in the interest rate: H" {3) g d; _ am 3Y1 Therefore the money-market ,z' LM equation imposes a positive relationship between Y1 and i. What is this telling us in economic terms?r Suppose GDP is higher. People will want to carry out a lot of transactions, so they will want to hold a lot of money to do this. But, by assumption, the money supply is xed, so it's impossible for all of them to hold more money at the sarne time. So the opportunity cost of holding money (the nominal interest rate) rises until people are content with holding exactly MS units of money. How exactly does this adjustment take place? [11 the background, there is a market where people exchange interest-bearing assets like bonds for non-interest-bearing money. If people want to carry out a lot of transactions, they will be trying to sell bonds in exchange for money, so what happens is that the price of bonds falls. If you recall the basic Present Value formula from chapter 10, then for an asset like a bond that promises a xed future payment, a fall in the price is the same thing as a rise in the interest rate. If we plot the LM equation, it will look like an upward-sloping curve. IS-LM If we put the IS and LM equations together, we can jointly gure out the level of output and interest rates, as shown in Figure 16.5.1. The figure shows the downward-sloping IS relationship and the upward-sloping LM relationship. The point Y,\17.1 How the Model Economy Behaves Let's see how the economy would respond to various shocks according to the New Keynesian model. We'll start by analyzing the same shocks that we looked at in chapter 15 and then we'll look at other possibilities. Recall, the behavior of the economy can be summarized by the IS and LM equations, which relate output Y1 and nominal interest rates i: of (1/1 K p = ,5(1+2' pr (F2 (K m (17.1.1) M3 = mD (m) -p1 (111.2) with MS, p1 and 7r taken as exogenous. Productivity shocks Suppose we look at the same kind of productivity shock that we looked at in chapter 15: the production function goes from K = F1 (L) to Y] = AFl (L) with A > 1. Other things being equal, how would this affect the economy? If you look at equations (1?.1.1) and {17.1.2}, you'll notice that the production function does not appear anywhere. What's going on? In this model, output is demand-determined: We have assumed that firms expand and contract output to meet demand, and workers work however much it takes to satisfy this demand. An increase in productivity means that the economy can produce more output but not that it will produce more output. Output will only increase if there is more demand, and this shock does not affect demand directly. Sometimes economists make the distinction between \"supply" effects and \"demand\" effects. These terms are often used imprecisely but in this example they are reasonably clear. Higher productivity is a supply effect: more can be produced with the same inputs. However, with no change in demand there will be no change in quantity. Figure 17.1.1: An increase in impatience [fall in ,6). When people become impatient, they want to consume more now. All the purchases they make induce producers to increase production, leading to an increase in output and employment. At the same time, the increase in output requires more transactions, which increases the demand for money. Since we are holding the money supply constant, this means that the interest rate rises to clear the money market: a movement along the LM curve. In turn this higher interest rate lowers investment. 298 Updated osrndgaois 17.1. HOW THE MODEL WORKS CHAPTER 1?. APPLICATIONS OF NK MODEL Notice how different this is from what happens in the RBC model. In the BBC model, an increase in impatience makes consumption go up but employment go down, because there is no way to escape the logic of equation (15.1.2): rimL) 1" (Ell =Fi{L} which implies that if households want more consumption then, other things being equal, they want more leisure as well. In the New Keynesian model this condition doesnlt hold because workers are not choosing how much they work in response to shocks in a utility-maximizing way: they just accommodate the level of demand they face. Still, as a theory of why we observe business cycles we haven't quite nailed it. Impatience shocks make output, employment and consumption move together, but investment moves the opposite way, so they carmot be the whole story. Optimism Suppose households predict an increase in future productivity: the production function for period 2 goes from Y2 = F2 (K) to Y2 = AFg {K} with A > 1. Now the investment function (16.5.2) becomes K _ ,_1 1+?" (was) ( A ) which means investment is increasing in A. The IS equation is now: u'(Y1K(H,A)}=(1+ia}a'[AF2(K(iW,A)}) It's easg,r to trace out that higher A lowers the right hand side and raises the left hand sideI which has the effect of shifting the IS curve to the right, as shown in Figure 17.1.2. Laziness or taxes Suppose, like we did in chapter 15, that there is an increase in labor-income taxes (or equivalently, households' preference for leisure increases}, so that equation {16.2.4} becomes: W: FilenTlflT) Other things being equal, how would this affect the economy? If you look at equations (17.1.1) and (17.1.2), youill notice that neither preferences for leisure, taxes nor the production function appear anywhere. As with productivity shocks, this would have no effect on output or interest rates because there is no effect on demand.1 Taxes certainly affect worker's incentives to choose between work and leisure but we have assumed that, due to sticky prices, they are not responding to those incentives anyway, so they have no effect. 5. IS-LM model and the value of Commitment (30 Points) This question will help you understand the IS-LM model in great detail. We derive the IS-LM model. There is a single household that is alive for two periods: (C1 - 0Lite ) 1-0 U Ite BC-0 1-0 - 0 where ciand care consumption of the production good in each period and L is the household's labor supply in period 1. The budget constraints in both periods are: C + K = -L+II1, P1 P2C2 = rK K + K. Here, II stand for the profits of monopolistic behaving firms. Here households invest in capital K only to invest in it and rent it out later. Production in each period is produced by firms operating the following technologies: Y1 = L, Y2 = K1-a Different from model's we've seen before, now the household invests directly in capital, and then rents it to firms at time t = 2. (a) [5 points, easy] Demonstrate that the labor supply is given by w = OLE. p1 (b) [5 points, easy] Show that the households optimal investment in K is given by (the Euler equation): ( C - B ) = B(1 + * * ) ( c2 ) - 0 . (c) [2 points, easy] Show that if firms at t = 2 behave competitively, the maximization of their profits leads to the following equilibrium return on capital: rk = (1 - a) Ka - K= (1-0)]1/ (d) [3 points, easy] Assume that firms ideally want to charge a markup relative to marginal costs given by: Pi = Cq n - 1 markup where the nominal marginal cost is simply the wage: Cq = W.We assume that n/ (n 1) > 1. Show that the target individual price is given by: e W .: = 9L -. P P1 7} _ 1 (e) [5 points, easy] Assume that the Central Bank, that is, the Federal Reserve can chose a quantity of money M, to target an interest interest rate 3'. Furthermore, it guarantees and ination rate between t = 1 and t = 2 given by W2, which we can treat as exogenous. We won't care about how it achieves this policy at t = 2. Argue that in that case: the Central Bank determines the real return on capital: rK=1r2, thereby affecting real investment in the economy. (1') [10 points, Intermediate] We now derive the IS curve. We assume that all rms x their prices in advance, prior to the governments choice. Use the production function Y = L to show that the I-S equation in this version of the new-Keynesian model is given by the following relationship between output and the nominal interest rate: 1/(1+s) _ lfor _ (10)}.1 HY = .1 0 Has.1 . .1"! . 1+8 t'z (1+zir2) 'g Hint: us that Y = K + c1, and substitute this condition into the Euler equation. Demonstrate that the relationship between these Y and r' is negative, that is, for a higher interest rate, output is declining. Draw this curve. What are the effects of increases in interest rates today? What happens if the private sector expects higher ination in the future? Is higher future ination expansionary or recessionary
Step by Step Solution
There are 3 Steps involved in it
Step: 1
Get Instant Access to Expert-Tailored Solutions
See step-by-step solutions with expert insights and AI powered tools for academic success
Step: 2
Step: 3
Ace Your Homework with AI
Get the answers you need in no time with our AI-driven, step-by-step assistance