

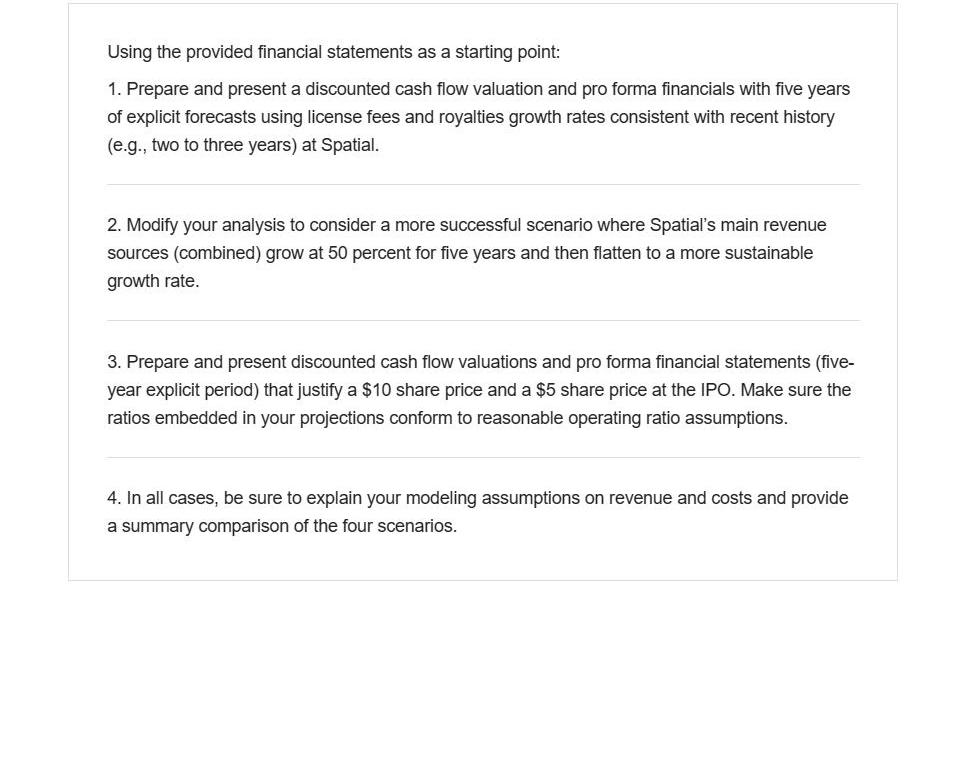
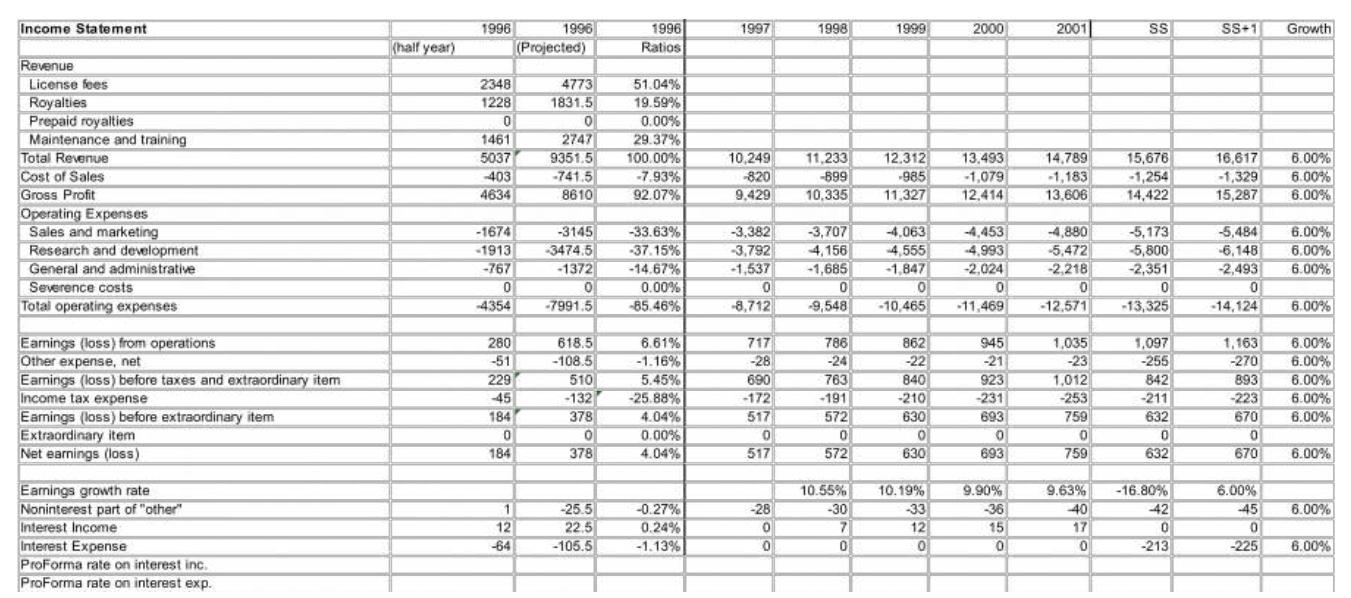
Using the provided financial statements as a starting point: 1. Prepare and present a discounted cash...
Fantastic news! We've Found the answer you've been seeking!
Question:
Transcribed Image Text:
Using the provided financial statements as a starting point: 1. Prepare and present a discounted cash flow valuation and pro forma financials with five years of explicit forecasts using license fees and royalties growth rates consistent with recent history (e.g., two to three years) at Spatial. 2. Modify your analysis to consider a more successful scenario where Spatial's main revenue sources (combined) grow at 50 percent for five years and then flatten to a more sustainable growth rate. 3. Prepare and present discounted cash flow valuations and pro forma financial statements (five- year explicit period) that justify a $10 share price and a $5 share price at the IPO. Make sure the ratios embedded in your projections conform to reasonable operating ratio assumptions. 4. In all cases, be sure to explain your modeling assumptions on revenue and costs and provide a summary comparison of the four scenarios. Income Statement Revenue License fees Royalties Prepaid royalties Maintenance and training Total Revenue Cost of Sales Gross Profit Operating Expenses Sales and marketing Research and development General and administrative Severence costs Total operating expenses Earnings (loss) from operations Other expense, net Earnings (loss) before taxes and extraordinary item Income tax expense Earnings (loss) before extraordinary item Extraordinary item Net earnings (loss) Earnings growth rate Noninterest part of "other" Interest Income Interest Expense ProForma rate on interest inc. ProForma rate on interest exp. (half year) 1996 2348 1228 0 1461 5037 -403 4634 -1674 -1913 -767 0 -4354 280 -51 229 -45 184 0 184 1 12 -64 1996 (Projected) 4773 1831.5 2747 9351.5 -741.5 8610 -3145 -3474.5 -1372 0 -7991.5 618.5 -108.5 510 -132 378 0 378 -25.5 22.5 -105.5 1996 Ratios 51.04% 19.59% 0.00% 29.37% 100.00% -7.93% 92.07% -33.63% -37.15% -14.67% 0.00% -85.46% 6.61% -1.16% 5.45% -25.88% 4.04% 0.00% 4.04% -0.27% 0.24% -1.13% 1997 10,249 -820 9,429 -3,382 -3,792 -1.537 0 -8,712 717 -28 690 -172 517 0 517 -28 0 0 1998 11,233 -899 10,335 -3,707 4,156 -1,685 0 -9,548 786 -24 763 -191 572 0 572 10.55% -30 7 0 1999 12.312 -985 11,327 -4,063 4,555 -1,847 0 -10.465 862 -22 840 -210 630 0 630 10.19% -33 12 0 2000 13,493 -1,079 12,414 -4,453 -4.993 -2,024 0 -11,469 945 -21 923 -231 693 0 693 9.90% -36 15 0 2001 14,789 -1,183 13,606 -4,880 -5,472 -2,218 0 -12.571 1,035 -23 1,012 -253 759 0 759 9.63% 40 17 0 SS 15,676 -1,254 14,422 -5,173 -5,800 -2,351 0 -13,325 1,097 -255 842 -211 632 0 632 -16.80% -42 0 -213 SS+1 16,617 -1,329 15,287 -5,484 -6,148 -2,493 0 -14,124 1,163 -270 893 -223 670 0 670 6.00% -45 0 -225 Growth 6.00% 6.00% 6.00% 6.00% 6.00% 6.00% 6.00% 6.00% 6.00% 6.00% 6.00% 6.00% 6.00% 6.00% 6.00% Balance Sheet Current assets Required Cash Excess Cash Accounts receivable Prepaid expenses, etc. Total current assets Equipment, net Purchased software, not Total assets Current liabilities Notes payable Accounts payable Accrued royalties pble Other accrueds Deferred revenue Total current liabilities Noncument notes payable (ad hoc about 31% MVEntity) Total abilities Convertible preferred Par common Additional paid-in cap Deficit/Retained eamings Treasury stock Foreign currency trans Total Equity Balance Total Liabilities & Equity Statement of cash flow Net eamings +D&A -Change in AR -Change in prepaids Change in AP +Change in accrueds +Change in det rev -Capex +Exercise proceeds Notes proceeds Currency transl, losses -Cash dump (dividend) Change in cash Beginning cash Ending cash Check Valuation Cash Flows (marginal tax rate used) Net Income +DSA -Capex -Change in NWC (incl. all cash) -Currency translation losses +Debt Proceeds Equity VCF from operations Check Dividends Terminal Value Total Equity VCF Discount Rates End of Year Equity Value Premoney Shares (Fully-Full Diluted including warrants) Share Price (mid-year) 1996 390 2293 171 2854 373 410 3637 0 410 396 1231 1779 3818 0 3818 14155 11 419 14688 0 -78 -181 (Projected) 3637 1996 390 0 2293 171 2854 373 410 3637 0 410 398 1231 1779 3818 0 3818 0 52 14533 -14660 0 -78 -181 3637 $1,728 5,937,223 $0.29 1996 Ratios 4.2% 24.5% 1.8% 30.5% 4.0% 4.4% 38.9% 0.0% 4.4% 4.3% 13.2% 19.0% 40.8% 0.0% 40.8% NA 1997 430 131 2.511 184 3.257 410 451 4,118 0 451 441 1,353 1.537 3,782 0 3,782 4,118 517 243 -218 -13 41 165 242 0 52 14.533 14,533 -14.171 -13,599 0 0 -78 -78 908 336 -321 0 0 O 0 172 390 561.814 561.814 €22530000 -321 439 1998 472 234 2.752 202 3,660 449 494 4,604 m 0 494 483 1,483 1,236 3.696 0 3.696 0 52 4,604 572 267 -241 -18 43 172 -302 -350 0 0 0 0 144 562 706.053 706.053 25% 572 267 -350 489 0 0 0 0 23.93% 0 1999 0 23.03% 23.93% 517 307 3.016 222 4.062 492 542 5,097 0 542 529 1,625 862 3,568 0 3,558 01 52 14.533 -12.960 0 -78 1,538 5.097 630 293 -264 -19 47 189 -374 -383 0 0 0 0 25% 630 293 -383 -540 2000 0 0 0 0 567 342 3.306 243 4,457 540 594 5.591 0 594 580 1,781 405 3.360 0 3.360 5.591 693 321 -290 -21 52 207 -457 -420 118 84 706 824 824.391 908.708 824.391 906 708 0 0 0 0 0 0 0 52 52 52 14,533 14.533 14.533 -12.276 -13,411 -13.345 0 0 0 -78 -78 -78 1,162 2.231 1,096 25% 2001 693 321 420 -693 0 0 0 0 621 0 3.623 266 4,511 592 651 5.753 0 651 636 1.952 0 3.239 1,418 4.657 5,753 759 351 -317 -23 57 227 405 -460 25% SS 759 351 4601 -174 658 0 3.841 282 4,781 627 690 6,098 0 1,418 1,894 1,894 0 690 674 2.069 0 3,433 1,503 4,936 6.098 0 566 0 1,418 0 -1,894 -288 909 621 621.133 658.400 621.131 658.399 37 632 385 -217 -16 39 155 0 460 0 85 25% g 6.00% 0 0 23.93% 23.93% $3,156 $2,141 $2,653 $3,288 $4,075 $3,346 5.937.223 5.937.223 5.937.223 5,937,223 5,937.223 5.937,223 $0.36 $0.45 $0.55 $0.69 $0.53 $0.56 632 385 -460 -76 0 85 566 566 3,156 5,051 23.93% 23.93% 3,346 SS+1 698 0 4,071 299 5,068 665 731 6,464 0 731 715 2,193 0 3,639 1,593 5,232 0 52 14.533 -13.275 0 -78 1,232 6,464 670 408 -230 -17 41 165 0 -487 0 90 0 600 40 658 697.902 697.903 25% 670 408 -457 -81 0 90 600 600 Growth 6.00% 5,937.223 $0.60 6.00% 6.00% 6.00% 6.00% 6.00% 6.00% 6.00% 6.00% 6.00% 6.00% 6.00% 6.00% 6.00% 6.00% 6.00% 6.00% 6.00% 6.00% 6.00% 6.00% 6.00% 6.00% 6.00% 6.00% 6.00% 6.00% 6.00% 3.546 6.00% 23.93% $3,546 6.00% 6.00% Using the provided financial statements as a starting point: 1. Prepare and present a discounted cash flow valuation and pro forma financials with five years of explicit forecasts using license fees and royalties growth rates consistent with recent history (e.g., two to three years) at Spatial. 2. Modify your analysis to consider a more successful scenario where Spatial's main revenue sources (combined) grow at 50 percent for five years and then flatten to a more sustainable growth rate. 3. Prepare and present discounted cash flow valuations and pro forma financial statements (five- year explicit period) that justify a $10 share price and a $5 share price at the IPO. Make sure the ratios embedded in your projections conform to reasonable operating ratio assumptions. 4. In all cases, be sure to explain your modeling assumptions on revenue and costs and provide a summary comparison of the four scenarios. Income Statement Revenue License fees Royalties Prepaid royalties Maintenance and training Total Revenue Cost of Sales Gross Profit Operating Expenses Sales and marketing Research and development General and administrative Severence costs Total operating expenses Earnings (loss) from operations Other expense, net Earnings (loss) before taxes and extraordinary item Income tax expense Earnings (loss) before extraordinary item Extraordinary item Net earnings (loss) Earnings growth rate Noninterest part of "other" Interest Income Interest Expense ProForma rate on interest inc. ProForma rate on interest exp. (half year) 1996 2348 1228 0 1461 5037 -403 4634 -1674 -1913 -767 0 -4354 280 -51 229 -45 184 0 184 1 12 -64 1996 (Projected) 4773 1831.5 2747 9351.5 -741.5 8610 -3145 -3474.5 -1372 0 -7991.5 618.5 -108.5 510 -132 378 0 378 -25.5 22.5 -105.5 1996 Ratios 51.04% 19.59% 0.00% 29.37% 100.00% -7.93% 92.07% -33.63% -37.15% -14.67% 0.00% -85.46% 6.61% -1.16% 5.45% -25.88% 4.04% 0.00% 4.04% -0.27% 0.24% -1.13% 1997 10,249 -820 9,429 -3,382 -3,792 -1.537 0 -8,712 717 -28 690 -172 517 0 517 -28 0 0 1998 11,233 -899 10,335 -3,707 4,156 -1,685 0 -9,548 786 -24 763 -191 572 0 572 10.55% -30 7 0 1999 12.312 -985 11,327 -4,063 4,555 -1,847 0 -10.465 862 -22 840 -210 630 0 630 10.19% -33 12 0 2000 13,493 -1,079 12,414 -4,453 -4.993 -2,024 0 -11,469 945 -21 923 -231 693 0 693 9.90% -36 15 0 2001 14,789 -1,183 13,606 -4,880 -5,472 -2,218 0 -12.571 1,035 -23 1,012 -253 759 0 759 9.63% 40 17 0 SS 15,676 -1,254 14,422 -5,173 -5,800 -2,351 0 -13,325 1,097 -255 842 -211 632 0 632 -16.80% -42 0 -213 SS+1 16,617 -1,329 15,287 -5,484 -6,148 -2,493 0 -14,124 1,163 -270 893 -223 670 0 670 6.00% -45 0 -225 Growth 6.00% 6.00% 6.00% 6.00% 6.00% 6.00% 6.00% 6.00% 6.00% 6.00% 6.00% 6.00% 6.00% 6.00% 6.00% Balance Sheet Current assets Required Cash Excess Cash Accounts receivable Prepaid expenses, etc. Total current assets Equipment, net Purchased software, not Total assets Current liabilities Notes payable Accounts payable Accrued royalties pble Other accrueds Deferred revenue Total current liabilities Noncument notes payable (ad hoc about 31% MVEntity) Total abilities Convertible preferred Par common Additional paid-in cap Deficit/Retained eamings Treasury stock Foreign currency trans Total Equity Balance Total Liabilities & Equity Statement of cash flow Net eamings +D&A -Change in AR -Change in prepaids Change in AP +Change in accrueds +Change in det rev -Capex +Exercise proceeds Notes proceeds Currency transl, losses -Cash dump (dividend) Change in cash Beginning cash Ending cash Check Valuation Cash Flows (marginal tax rate used) Net Income +DSA -Capex -Change in NWC (incl. all cash) -Currency translation losses +Debt Proceeds Equity VCF from operations Check Dividends Terminal Value Total Equity VCF Discount Rates End of Year Equity Value Premoney Shares (Fully-Full Diluted including warrants) Share Price (mid-year) 1996 390 2293 171 2854 373 410 3637 0 410 396 1231 1779 3818 0 3818 14155 11 419 14688 0 -78 -181 (Projected) 3637 1996 390 0 2293 171 2854 373 410 3637 0 410 398 1231 1779 3818 0 3818 0 52 14533 -14660 0 -78 -181 3637 $1,728 5,937,223 $0.29 1996 Ratios 4.2% 24.5% 1.8% 30.5% 4.0% 4.4% 38.9% 0.0% 4.4% 4.3% 13.2% 19.0% 40.8% 0.0% 40.8% NA 1997 430 131 2.511 184 3.257 410 451 4,118 0 451 441 1,353 1.537 3,782 0 3,782 4,118 517 243 -218 -13 41 165 242 0 52 14.533 14,533 -14.171 -13,599 0 0 -78 -78 908 336 -321 0 0 O 0 172 390 561.814 561.814 €22530000 -321 439 1998 472 234 2.752 202 3,660 449 494 4,604 m 0 494 483 1,483 1,236 3.696 0 3.696 0 52 4,604 572 267 -241 -18 43 172 -302 -350 0 0 0 0 144 562 706.053 706.053 25% 572 267 -350 489 0 0 0 0 23.93% 0 1999 0 23.03% 23.93% 517 307 3.016 222 4.062 492 542 5,097 0 542 529 1,625 862 3,568 0 3,558 01 52 14.533 -12.960 0 -78 1,538 5.097 630 293 -264 -19 47 189 -374 -383 0 0 0 0 25% 630 293 -383 -540 2000 0 0 0 0 567 342 3.306 243 4,457 540 594 5.591 0 594 580 1,781 405 3.360 0 3.360 5.591 693 321 -290 -21 52 207 -457 -420 118 84 706 824 824.391 908.708 824.391 906 708 0 0 0 0 0 0 0 52 52 52 14,533 14.533 14.533 -12.276 -13,411 -13.345 0 0 0 -78 -78 -78 1,162 2.231 1,096 25% 2001 693 321 420 -693 0 0 0 0 621 0 3.623 266 4,511 592 651 5.753 0 651 636 1.952 0 3.239 1,418 4.657 5,753 759 351 -317 -23 57 227 405 -460 25% SS 759 351 4601 -174 658 0 3.841 282 4,781 627 690 6,098 0 1,418 1,894 1,894 0 690 674 2.069 0 3,433 1,503 4,936 6.098 0 566 0 1,418 0 -1,894 -288 909 621 621.133 658.400 621.131 658.399 37 632 385 -217 -16 39 155 0 460 0 85 25% g 6.00% 0 0 23.93% 23.93% $3,156 $2,141 $2,653 $3,288 $4,075 $3,346 5.937.223 5.937.223 5.937.223 5,937,223 5,937.223 5.937,223 $0.36 $0.45 $0.55 $0.69 $0.53 $0.56 632 385 -460 -76 0 85 566 566 3,156 5,051 23.93% 23.93% 3,346 SS+1 698 0 4,071 299 5,068 665 731 6,464 0 731 715 2,193 0 3,639 1,593 5,232 0 52 14.533 -13.275 0 -78 1,232 6,464 670 408 -230 -17 41 165 0 -487 0 90 0 600 40 658 697.902 697.903 25% 670 408 -457 -81 0 90 600 600 Growth 6.00% 5,937.223 $0.60 6.00% 6.00% 6.00% 6.00% 6.00% 6.00% 6.00% 6.00% 6.00% 6.00% 6.00% 6.00% 6.00% 6.00% 6.00% 6.00% 6.00% 6.00% 6.00% 6.00% 6.00% 6.00% 6.00% 6.00% 6.00% 6.00% 6.00% 3.546 6.00% 23.93% $3,546 6.00% 6.00%
Expert Answer:
Answer rating: 100% (QA)
Here are the DCF valuations and pro forma financial projections for Spatial under the four scenarios requested 1 Base case DCF with 23 revenue growth ... View the full answer

Related Book For 
Posted Date:
Students also viewed these finance questions
-
Brinpool plc has been invited to build a factory in the small state of Gehell by the government of that country. The local currency is the Ked (K) and data on current and expected exchange rates are...
-
United Airlines inaugurated service to Japan and wants to finance the purchase of Boeing 747s to service that route. The CFO for United is attracted to yen financing because the interest rate on yen...
-
GZ plc plans to build a factory in the USA for $3.4m. Additional investment in working capital of $500,000 would be needed and this would be financed by a loan from a US bank of $500,000. Annual...
-
In a 2 to 3 body page paper (excluding reference page) provide your determination and analysis of Case below (from End of Chapter 5, Waldman & OReilly, 2020). You are a manager of a regional...
-
Business Horizons (BH) produces and markets DVDs for sale to the business community. It hires well-known business speakers to present new developments in their area of expertise in DVD format. The...
-
Solve the linear system \(\mathbf{A x}=\mathbf{b}\) by using a. The inverse of the coefficient matrix. b. 1 The "\" operator in MATLAB. \(\mathbf{A}=\left[\begin{array}{cccc}2 & 2 & 0 & 0 \\...
-
7. After graduating from college, you work hard for 15 years, saving money to buy your dream property. Finally, you spend all your savings to buy a 300-acre farm with a splendid house and pool....
-
You work for Nokia in its global cell phone group. You have been made project manager for the design of a new cell phone. Your supervisors have already scoped the project so you have a list showing...
-
Nickelon's cash flow from assets during the current year is $120 million, which is expected to grow at a constant rate of 7% in the future. The weighted average cost of capital is 11%. Part 1 What is...
-
A process is in control with x = 100.s = 1.05, and n = 5. The process specifications are at 95 ± 10. The quality characteristic has a normal distribution. (a) Estimate the potential...
-
THE ONLY INFO PROVIDED BY TEACHER ARE THE FOLLOWING; use java and full code please. The numbers are split into blocks groups of consecutive numbers. The blocki,j consists of number n i ,n i +1,...,n...
-
You are considering investing $10,000 into a mutual fund which has two classes available. Class A has a load of 5% and charges an annual management fee of 0.7%.Class B has no load, but charges an...
-
A stock had an average return of 14% when the risk free rate was 4.8%. The stock had a standard deviation of 28.2%. The stock's Sharpe ratio was _________.
-
AE Ltd incurred $831,000 of fixed overhead during the period. During that same period, the company applied $850,000 of fixed overhead to production and reported a favourable budget variance of...
-
Define the strategic objectives you want to establish and propose financial measures for the Real Madrid
-
What might Ms. Brooks do to correct the financial problems? Please be as specific as you can in outlining a course of action that you believe she should follow.
-
Please help. Thank you very much.The first few weeks we discussed the Business Processes andbusiness architecture of Canoo. The class as a whole focused on theHR system as well as manufacturing. Ev 1...
-
It is possible to investigate the thermo chemical properties of hydrocarbons with molecular modeling methods. (a) Use electronic structure software to predict cHo values for the alkanes methane...
-
Because ADRs are denominated in dollars and are traded in the United States, they present less foreign exchange risk to U.S. investors than do the underlying foreign shares of stock. Comment.
-
What factors affect a company's translation exposure? What can the company do to affect its degree of translation exposure?
-
1. How much rand revenue per ounce was Harmony generating on September 11, 2001? Three years later? 2. The average exchange rate during 2001:Q2 was R8.04/$; in 2004:Q2, it was R6.60/$. Compare...
-
General Manufacturing Company makes residential aluminum windows. A company has offered to supply General with the window crank assembly it needs for $3.50 each. General uses 50,000 crank assemblies...
-
Hutchens Electric produces electric fans, Hutchens manufactures 19,000 small electric fan motors each year. Dalta Motor Company has offered to supply Hutchens with the small electric motors for...
-
The Graham Corporation has annual sales of \($70\) million. The average collection period is 90 days. What is Grahams average investment in accounts receivable as shown on the balance sheet?

Study smarter with the SolutionInn App